

- Bitcoin has historically exhibited cyclical behavior, with pronounced “bull” and “bear” market phases.
- The current bull cycle in Bitcoin seems to be propelled by a mix of technical drivers, such as spot Bitcoin ETF inflows, and strong fundamental factors like positive stablecoin inflows and an increase in Total Value Locked (TVL) in DeFi applications.
- Cyclical indicators for Bitcoin suggest we are presently in the middle of the bull run—using a baseball analogy, perhaps around the fifth inning—with room for continued growth based on current trends.
- Considering the array of positive fundamental developments, it appears likely that the bull run will persist. However, investors may want to remain vigilant by monitoring spot Bitcoin ETF flows and macroeconomic indicators for signs of market shifts.
Are we in a Bull Market?
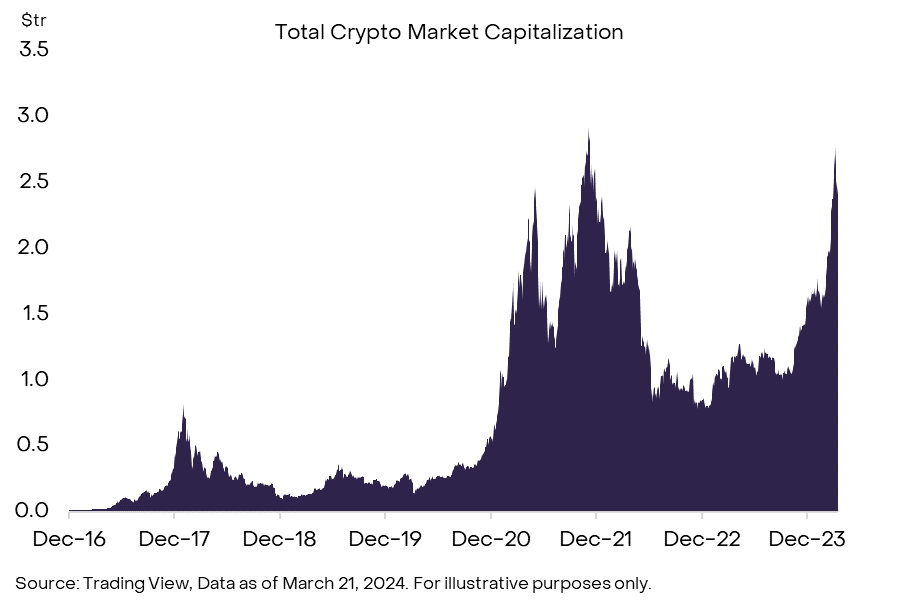
Bitcoin prices have rapidly surged to breach multiple all-time highs in the U.S. over the past month—rebounding quickly from the lows of 2023. In over 30 currency pairs, Bitcoin reached new all-time highs even earlier. This resurgence has captured the attention of news outlets, with daily reports on Bitcoin's price movements. But it doesn’t seem to stop there: traditional investment managers have even begun analyzing memecoins in their research notes—historically a telltale sign of the growing mainstream interest in cryptocurrency. As the overall crypto market cap nears its all-time peak (Exhibit 1), we must ask ourselves: Are we witnessing the onset of a new bull market?
Exhibit 1: Total crypto market cap nears all-time-highs
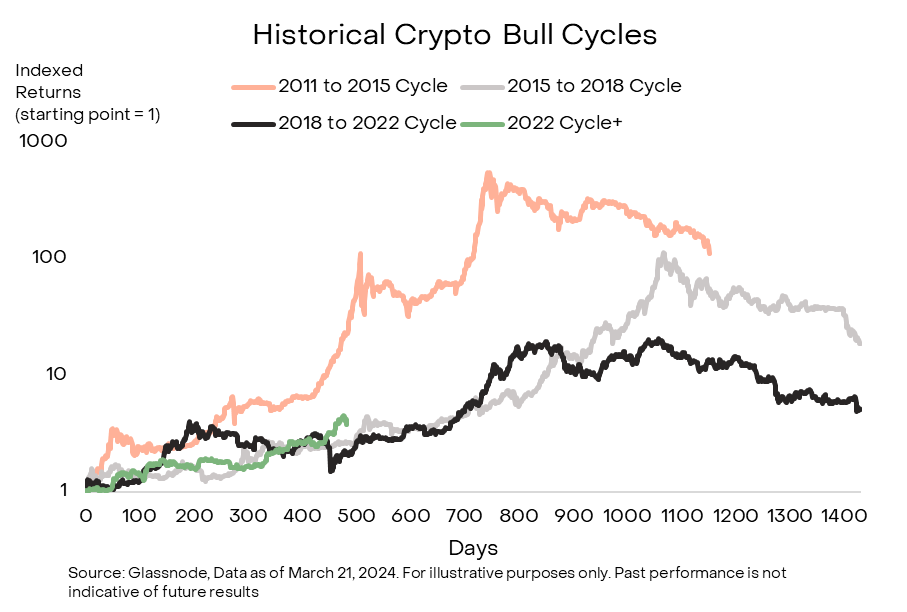
First, let's clarify what we mean by a bull market. Although an exact definition can be hard, a practical approach is to view bull markets as the approximately three to four year cycles that commence from the lowest price points of previous cycles (Exhibit 2). Typically, these cycles are characterized by a gradual uptrend in prices, peaking at cycle highs, followed by a period of stabilization or slight decline.
Exhibit 2: Crypto bull cycles visualized
Identifying the elements of a bull market can be challenging: What factors have propelled us to this point? What can we expect in terms of duration and sustainability?
The Precursor: Growing Bitcoin Dominance
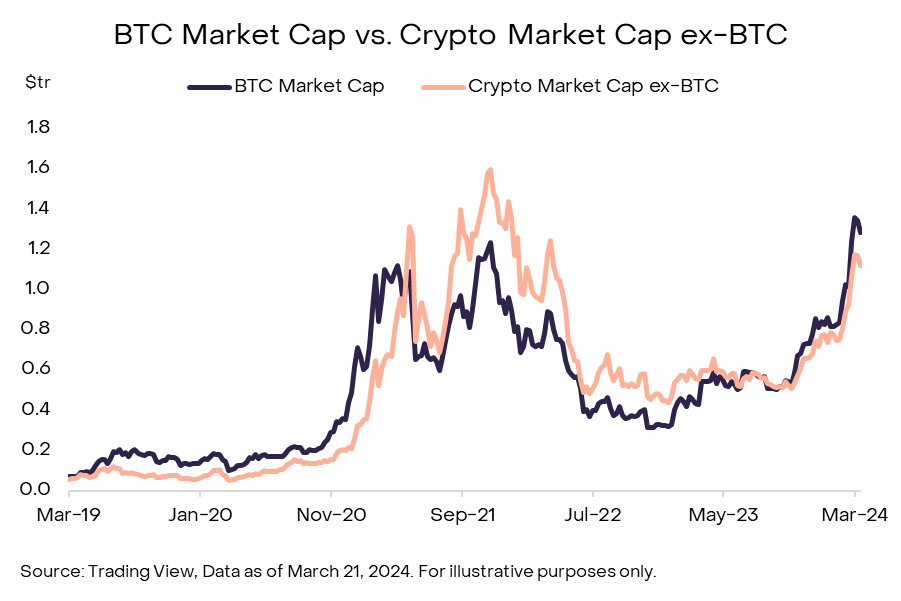
Historically, the beginning of crypto bull markets has often been marked by a surge in Bitcoin's “dominance,” a measure of Bitcoin's market value relative to the total cryptocurrency market. This trend emphasizes Bitcoin's role as a leading indicator for the broader crypto market. Typically, a rally in Bitcoin precedes wider gains across altcoins. Investors, after being buoyed by their Bitcoin profits, may venture into higher-risk cryptocurrencies in search of greater returns. This dynamic was observable during the 2021-2022 bull run, a period where Bitcoin's gains were swiftly followed by a significant uptick in altcoin valuations (Exhibit 3).
Exhibit 3: Bitcoin gains tend to precede altcoin gains
While the current cycle exhibits this familiar pattern of Bitcoin's increasing dominance paving the way for altcoin rallies, the distinguishing factors of this cycle lie in its unique catalysts. As we've explored previously, key drivers such as spot Bitcoin ETF inflows and enhanced onchain liquidity not only contribute to the current bull market's momentum but also signal a departure from the traditional dynamics observed in previous cycles.
Catalyst #1: Spot Bitcoin ETF Flows
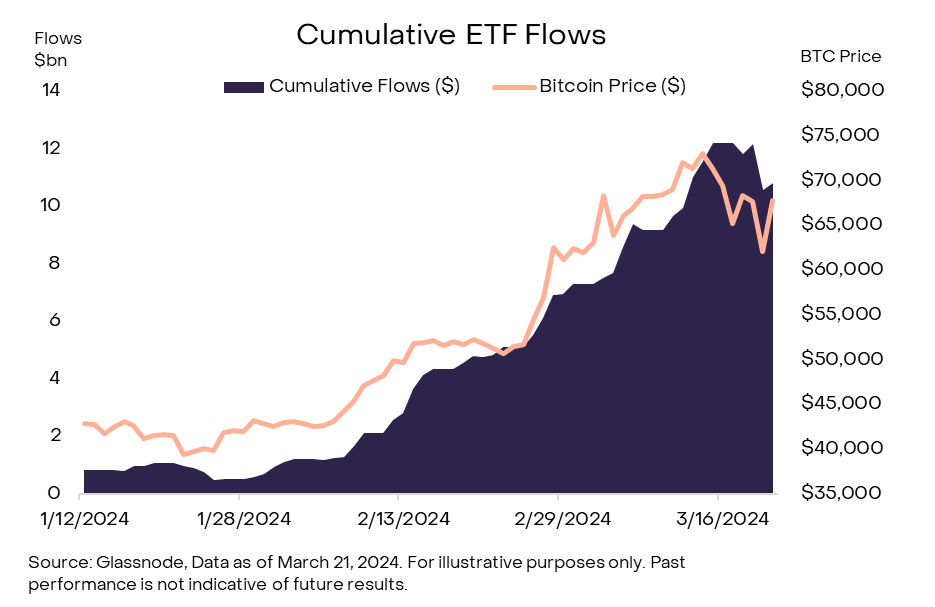
The first pivotal difference in this bull market compared to previous ones is the rapid change in positive market dynamics, largely influenced by spot Bitcoin ETF inflows. Since the ETF approvals in January, these inflows have consistently exceeded Bitcoin issuance by a magnitude of more than 3 times as of mid-March, which has put upwards pressure on the price (Exhibit 4).
Exhibit 4: Cumulative spot Bitcoin ETF inflows have pushed Bitcoin’s price upwards
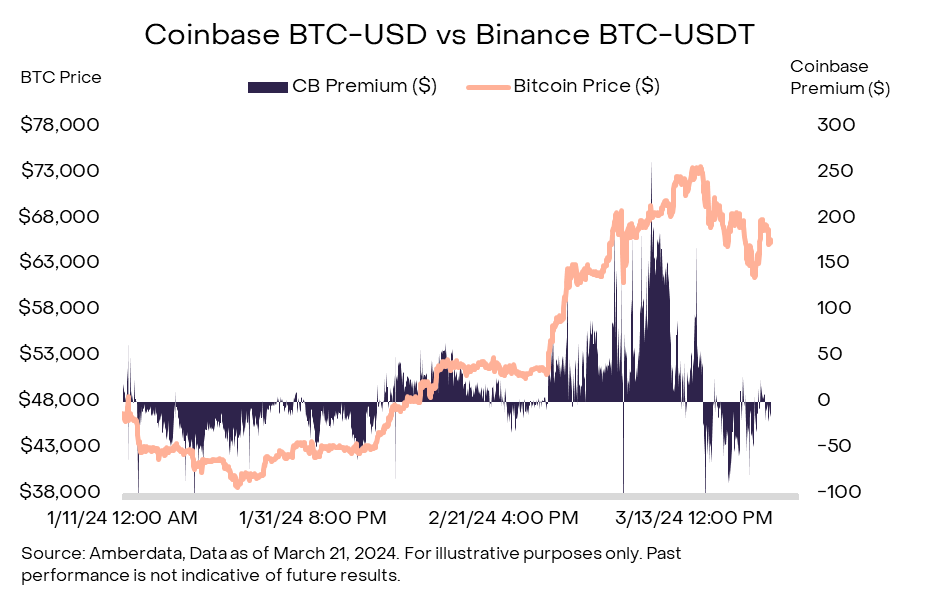
At a high level, when new shares of a spot Bitcoin ETF are created, the ETF has a need to source Bitcoin from the spot markets and take delivery of Bitcoin into the fund. In other words, creations result in a need to buy Bitcoin to match the increase in fund assets. Simply put, cash needs to be converted into Bitcoin in connection to primary market creations. This dynamic is evident when analyzing the Coinbase BTC-USD hourly premiums compared to Binance BTC-USDT (Exhibit 5). A higher premium on Coinbase suggests increased spot buying pressure from US investors, an indicator of the ETFs' presence in market dynamics.
Exhibit 5: Coinbase (CB) BTC-USD has a premium vs Binance BTC-USDT, indicating US buying pressure
Catalyst #2: Healthy Onchain Fundamentals
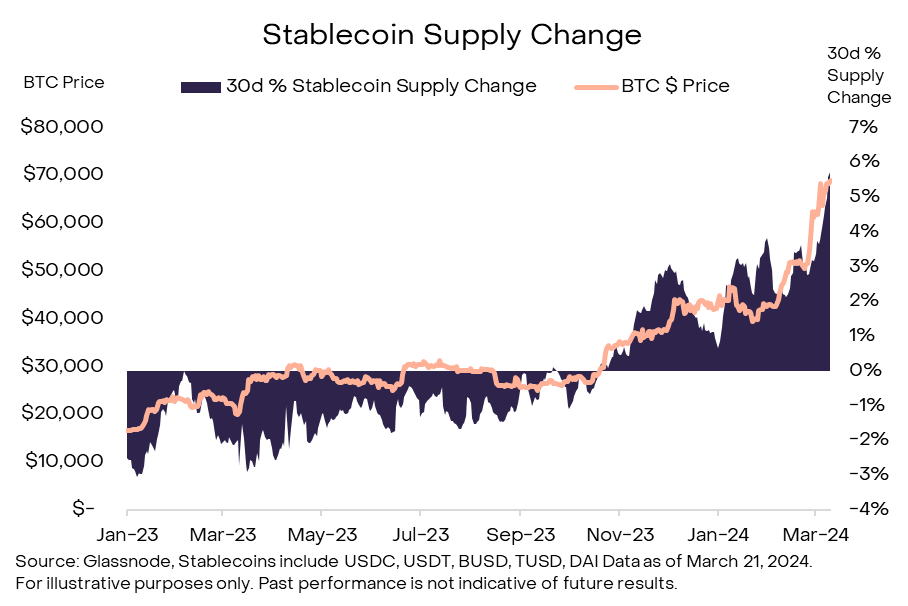
Onchain indicators have also signaled increasing liquidity. A key indicator from onchain data is the positive shift in stablecoin inflows. Stablecoins, which are digital currencies pegged to stable assets like the US dollar, play a crucial role in the cryptocurrency ecosystem. They are designed to offer a stable medium of exchange and also serve as the primary base pair for trading on most centralized and decentralized exchanges.
An increase in stablecoin liquidity means more capital is available for trading, either to purchase or sell cryptocurrencies. This influx of stablecoin capital, as indicated by rising stablecoin reserves on exchanges, typically fuels the momentum of bull markets (Exhibit 6).
Exhibit 6: Stablecoin Inflows correlate with BTC price
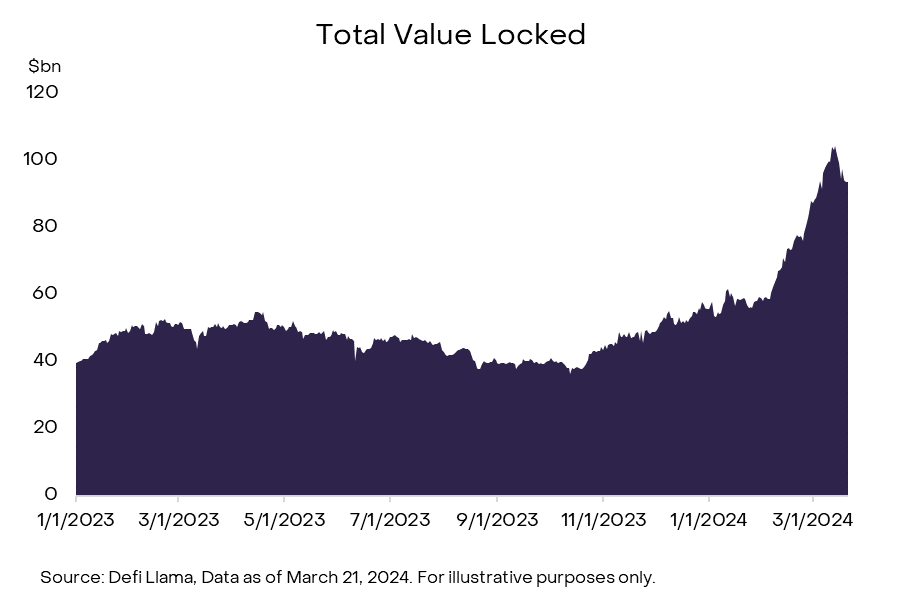
On a related note, onchain liquidity also appears to be growing substantially, as evidenced by the Total Value Locked (TVL) in decentralized finance (DeFi) applications (Exhibit 7). TVL aggregates the total value of assets deposited across various DeFi protocols, and serves as another metric for assessing the ecosystem's liquidity. An increasing TVL not only signifies enhanced liquidity within DeFi platforms but also indicates a growing level of user engagement in the ecosystem. This uptick in liquidity is crucial for the vitality of DeFi, helping facilitate smoother transactions and broader financial activities. Reflecting on fundamental onchain activities, it's noteworthy that the TVL in decentralized applications has more than doubled since the beginning of 2023 when it was approximately $40 billion, reaching approximately $100 billion by mid-March 2024.
Exhibit 7: Total value locked in DeFi has more than doubled since 2023
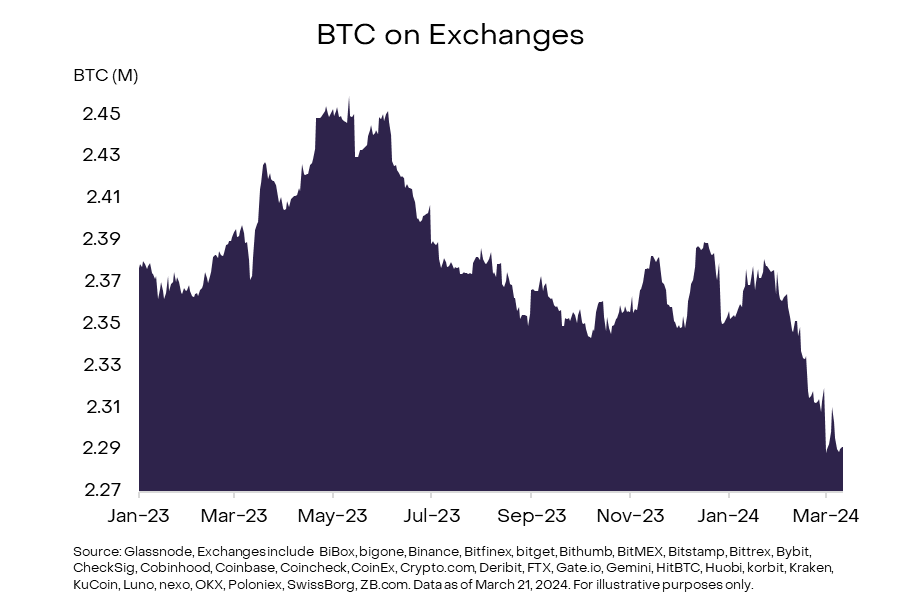
In addition, the noticeable decrease in Bitcoin held on exchanges, with a reduction of 7% since the local peak of Bitcoin supply in May 2023, signals a supply squeeze partly driven by spot Bitcoin ETFs transferring BTC into custodian cold wallets for long-term storage (Exhibit 8). Based on research from Glassnode, the proportion of total BTC held on exchanges has shrunk to approximately 12% of circulating supply, marking its lowest level in five years. This movement away from exchanges, traditionally viewed as a bullish indicator, suggests a preference for holding over selling, and investor confidence in Bitcoin's value. The consequent liquidity crunch, as demand gradually outpaces the supply on exchanges, not only highlights the influence of these spot Bitcoin ETFs but also reinforces the market’s bullish outlook for the crypto market.
Exhibit 8: Supply of Bitcoin on exchanges has fallen
Entering the Fifth Inning
Now that we’ve established the drivers that have contributed to the bull market, we need to assess where we stand. Despite the inherent uniqueness of each cycle, established onchain patterns and sentiment data have led us to believe that we are currently navigating the ‘mid-phase’ or the 'fifth inning' of the current bull cycle. While progress has been made, we believe there is still room left to run.
Market Value Realized Value + Net Unrealized Profit/Loss
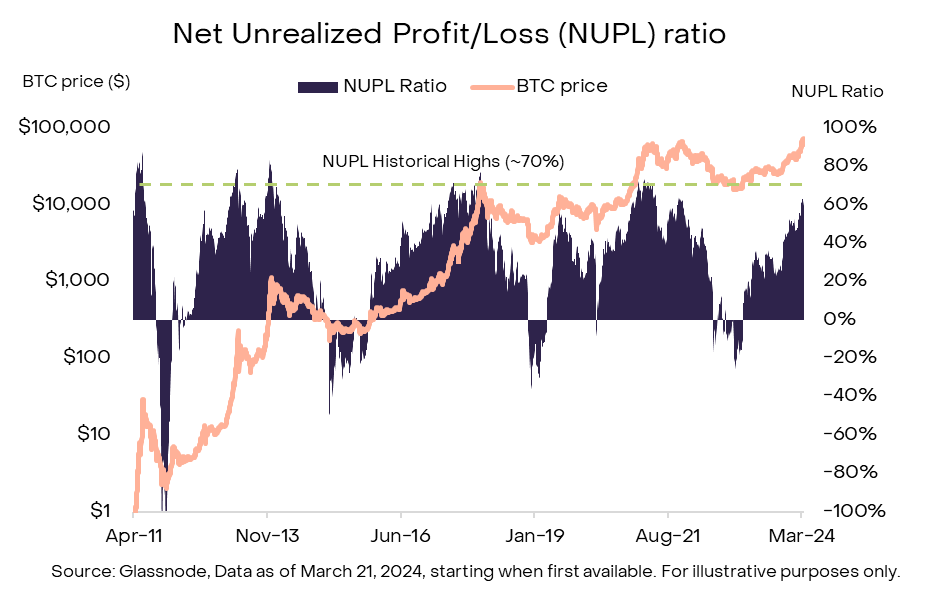
The Market Value / Realized Value (MVRV) indicator compares Bitcoin’s market value to the “realized value” or the price of all of that Bitcoin the last time it changed hands. Using this difference, the Net Unrealized Profit/Loss (NUPL) calculates the percentage profit/loss by dividing the difference of market value and realized value by the market cap. As Bitcoin prices rise and investors who bought in at a lower cost basis still hang on to their coins, the NUPL ratio rises. As of mid-March 2024, with a NUPL at ~60% and historical peaks occurring at profit ratios above 70%, it appears we may be approaching a cycle high on this measure (Exhibit 9).
Exhibit 9: NUPL reaching historical cycle highs
MVRV Z-Score
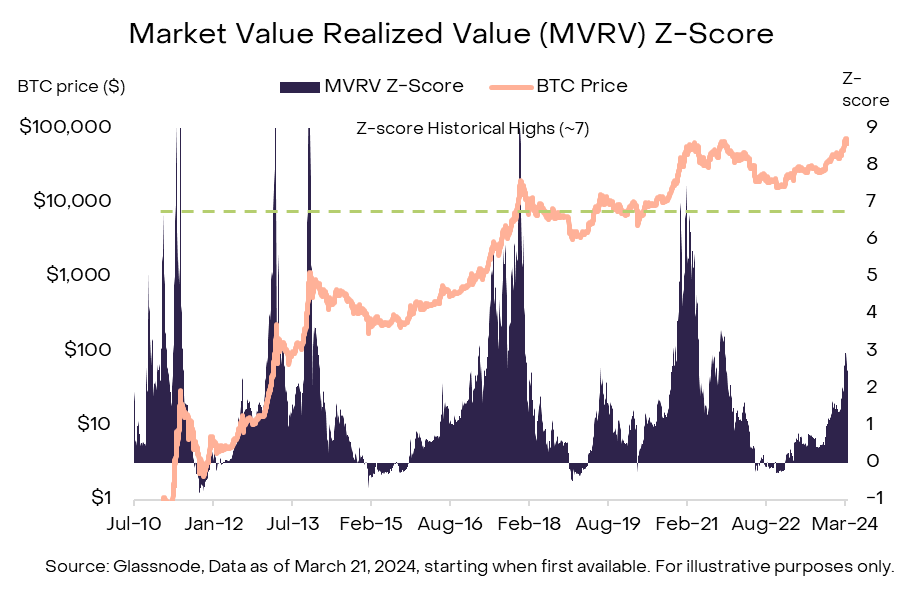
Conversely, the MVRV Z-Score offers a different perspective, indicating potential for further growth. This metric calculates the divergence between the market cap and the realized cap, adjusting for volatility with the market cap's rolling standard deviation. Historically, high Z-Scores, which reflect significant gaps between Market Value and Realized Value, have marked the peaks of cycles. Currently, with a Z-Score around 3— well below the levels seen at previous cycle peaks—there appears to be substantial room for additional upward movement (Exhibit 10).
Exhibit 10: MVRV Z-Score indicates we are not near the peak of the bull
ColinTalksCrypto Bitcoin Bull Run Index
For a broader perspective, the ColinTalksCrypto Bitcoin Bull Run Index (CBBI) offers a comprehensive view by synthesizing nine various ratios into a single number that measures progress of the bull run's phase (Exhibit 11). These ratios encompass a variety of values, including Bitcoin's price relative to its historical performance, onchain metrics indicating investor behavior, and broader market sentiment indicators. By integrating data from sources like the MVRV Z-Score, the Puell Multiple, and RHODL Ratio, among others, the CBBI is designed to provide a snapshot of broad market conditions. As of mid-March 2024, CBBI is positioned at 79 out of 100, which suggests we are approaching the cycle's peak, though the market still holds potential for further upward movement.
Exhibit 11: CBBI indicates we are closer to cycle peak
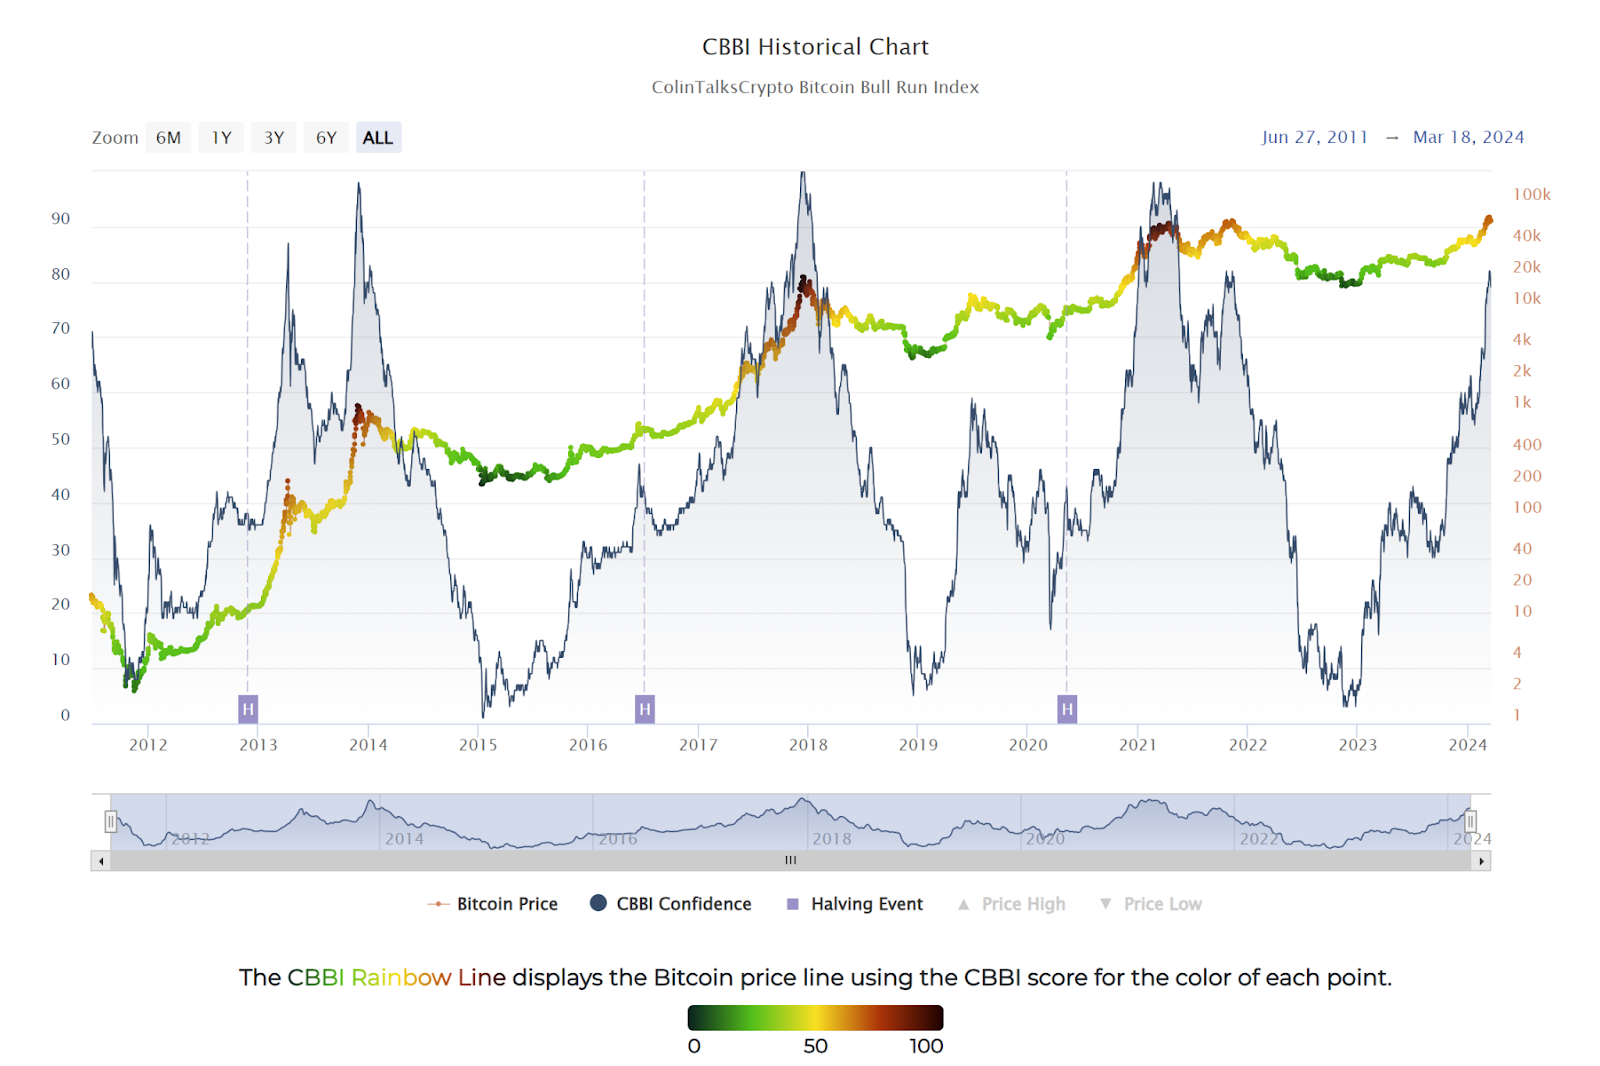
Source: colintalkscrypto.com, as of 3/18/24. Indexes are unmanaged and it is not possible to invest directly in an index. Past performance is not indicative of future results. For illustrative purposes only.
Retail Market Sentiment
However, sentiment data presents a contrasting picture. Subscription rates for cryptocurrency-related YouTube channels, which can serve as an indicator of retail investor interest, are notably lower than the enthusiasm seen during the 2020-2021 bull market. Yet, a recent uptick in subscriber growth rates suggests a slowly growing interest among retail investors (Exhibit 12).
Exhibit 12: Crypto Youtube subscriptions are still subdued
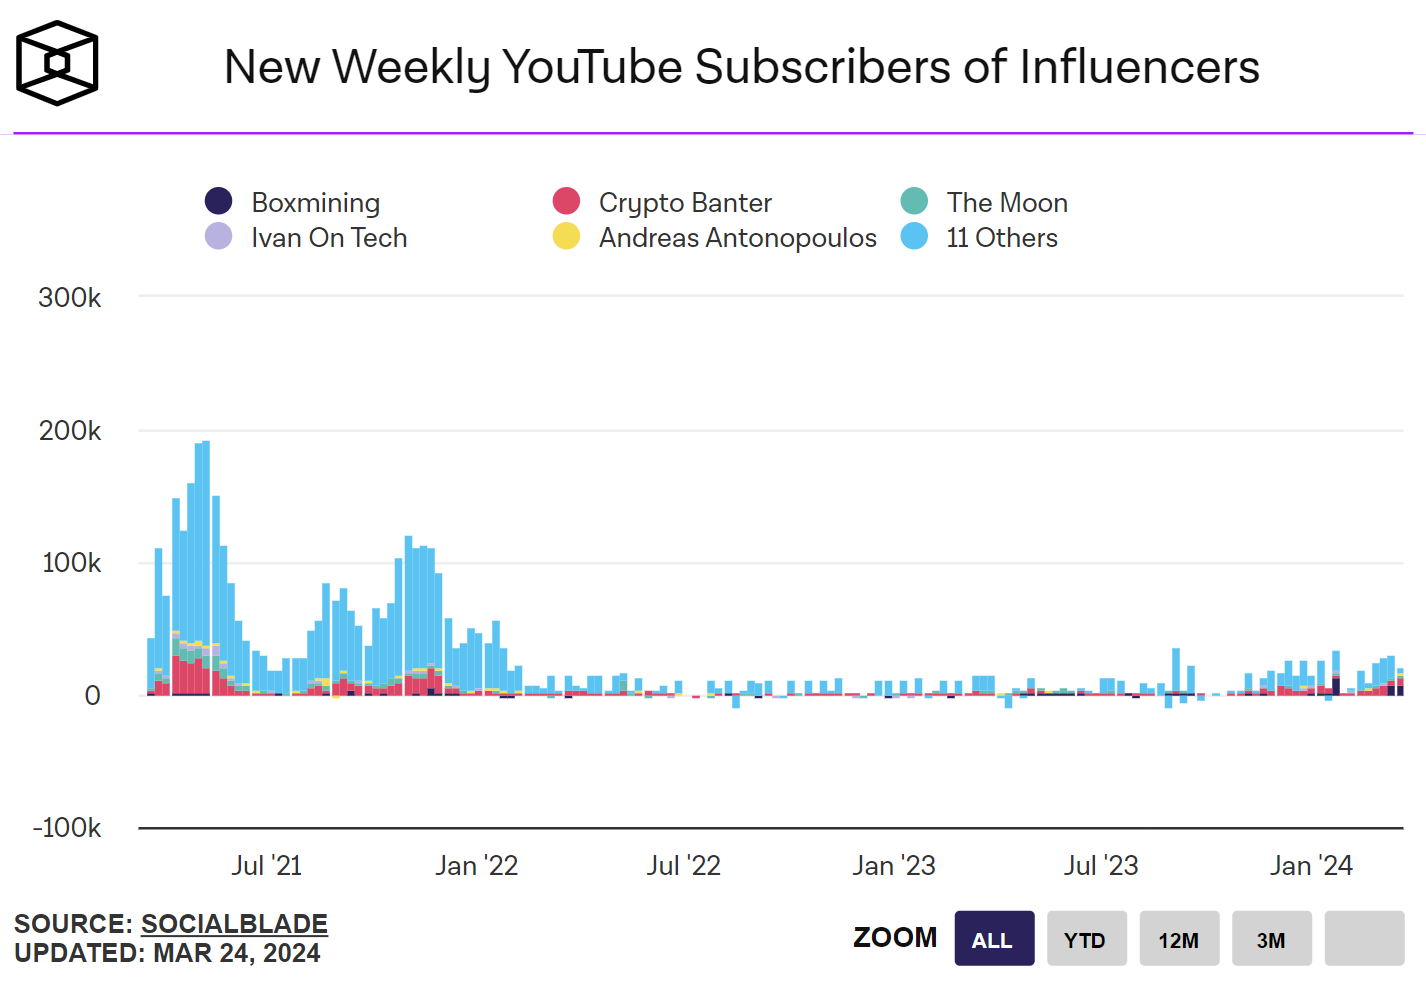
Source: The Block, Social Blade, as of 3/24/24. For illustrative purposes only.
Similarly, current search interest levels on Google Trends for the word “crypto” are markedly lower than the peaks seen in 2021, suggesting that the broader public's curiosity with cryptocurrency might not have fully rebounded (Exhibit 13). Google Trends shows how popular search terms are by giving them a score from 1 to 100 (Y-Axis). This score is based on a sample of Google searches, chosen randomly and without bias. A score of 100 means a term is at its peak popularity for the chosen time and place. This discrepancy raises questions about retail’s participation in the current cycle.
Exhibit 13: “Crypto” search popularity is subdued compared to the previous cycle
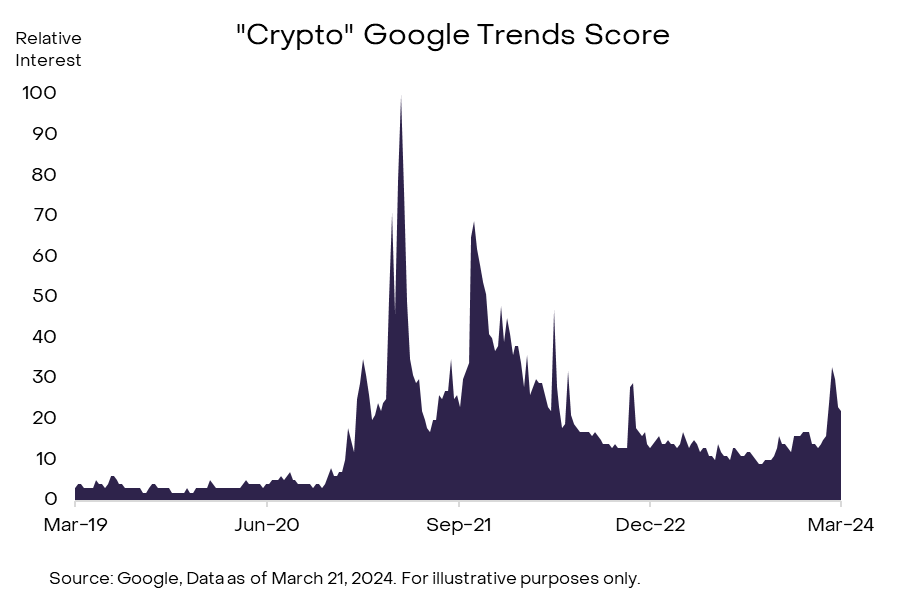
Source: Google trends, as of 3/18/24. For illustrative purposes only.
Mobile engagement, measured by the Coinbase app downloads, seems to signal growing interest among potential investors, peaking as it entered the top 100 around March 5th (Exhibit 14). However, a subsequent decline in its ranking indicates a possible cooling off or a shift in the platforms used by the market participants.
Exhibit 14: Coinbase app rankings hover around 300
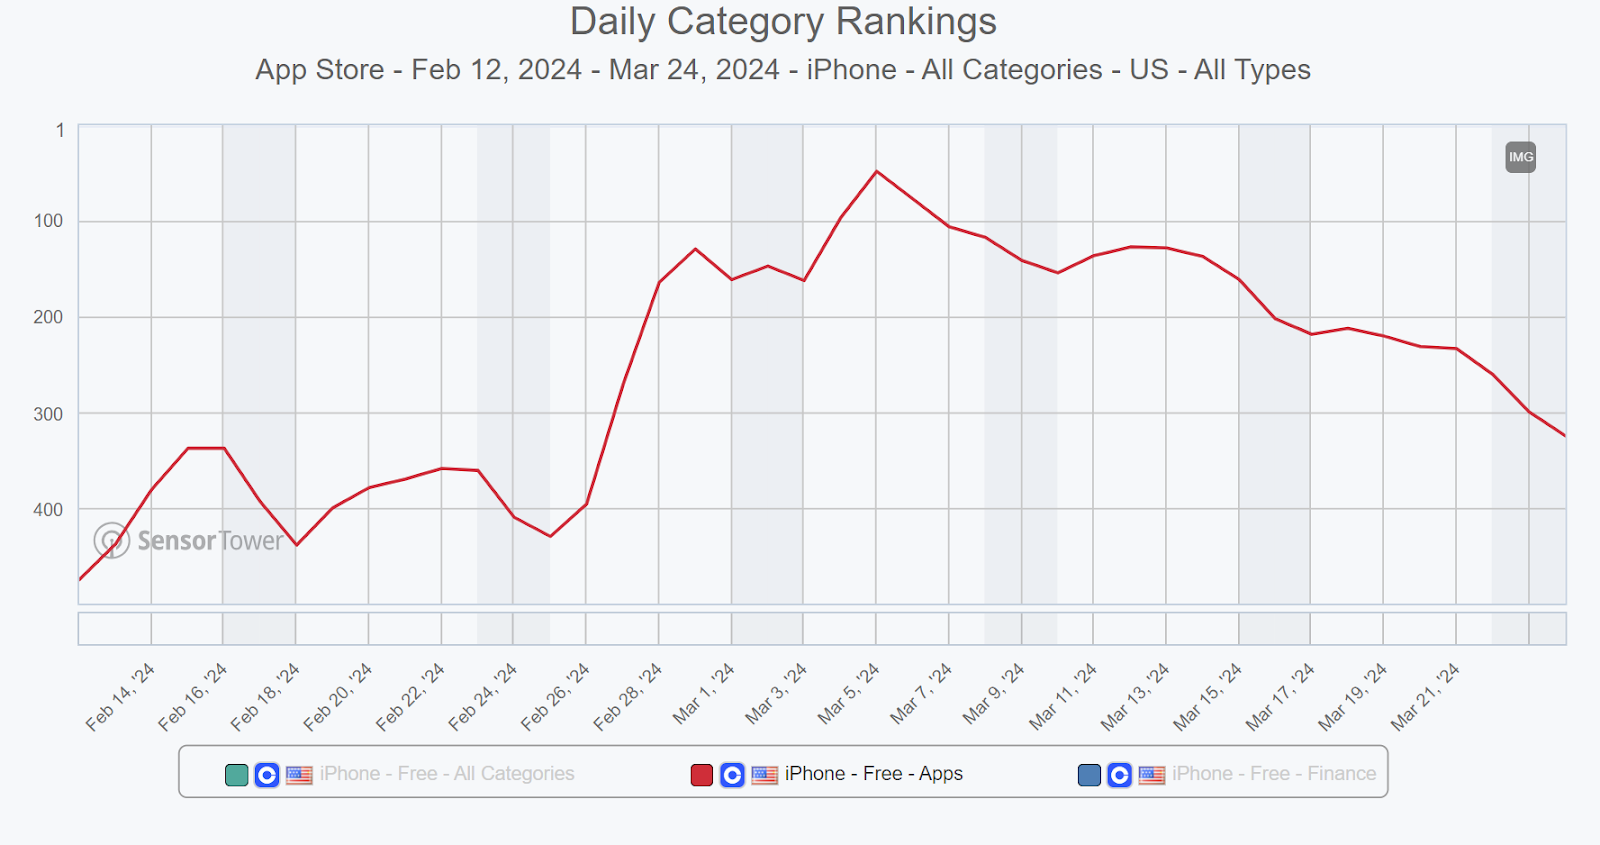
Source: SensorTower, as of 3/24/24. Data only available for this time frame. For illustrative purposes only.
To reconcile the rising prices/onchain metrics with the subdued retail sentiment, it's plausible to consider that the retail investors who fueled the previous cycle haven't fully re-entered the market. In our research, this cycle's momentum may be driven by a different type of investor—one less visible on social media platforms like Twitter or YouTube. The approval of spot Bitcoin ETFs has likely attracted investors more comfortable with traditional investment vehicles. This shift suggests a broader acceptance of Bitcoin, possibly extending its appeal beyond the typical crypto enthusiast to include those who prefer established financial products.
Untapped Future Catalysts
The outcome of the bull run has yet to be determined. Nonetheless, we hold a cautiously optimistic view, buoyed by potential catalysts such as increased retail and institutional participation, which could help propel the cycle's momentum forward.
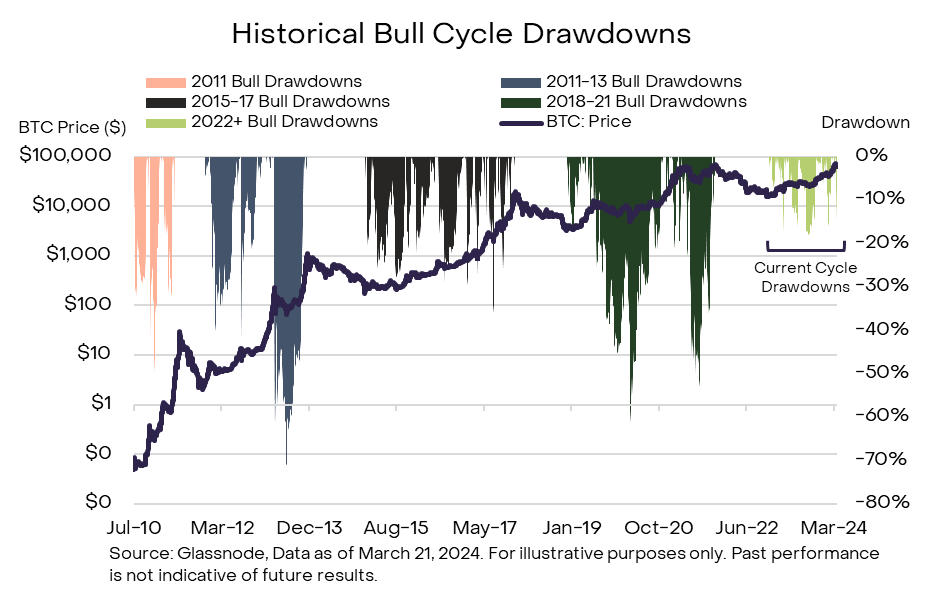
One thing we are cautious of is the behavior of new spot Bitcoin ETF buyers. Historically, BTC does experience a drawdown every bull cycle, so we aren’t sure how these new buyers will react when faced with a drawdown. Encouragingly, this cycle has experienced relatively minor drawdowns so far (Exhibit 15); the least severe when compared to those in past cycles.
Exhibit 15: The current bull cycle has seen the least amount of drawdowns
On the other hand, we recognize the presence of untapped demand. Alongside the previously-mentioned retail investors who have yet to return to the market, a segment of institutional players, such as wirehouses and wealth management firms, remain on the sidelines. However, a select group has begun to green-light spot Bitcoin ETFs for inclusion in advisor-managed portfolios. This cautious yet promising endorsement signals a substantial, yet untapped investment potential which we believe could either sustain or accelerate the market's upward trajectory.
Focal Points
Spot Bitcoin ETF flows and macroeconomic indicators currently serve as the primary forces shaping the near-term direction of Bitcoin's bull cycle, much like the two sides of a seesaw, with their influence oscillating over time. At certain junctures, spot Bitcoin ETF flows take the lead, while at others, macroeconomic factors gain the upper hand. This ever-shifting dynamic ensures our attention remains fixed on these elements, as they are likely to continue to dominate the narrative of Bitcoin's market behavior.
Our conviction in Bitcoin's performance as an asset class remains unwavering as we look to the future. Supported by advantageous market conditions and its established roles as a store of value and hard money, we believe Bitcoin stands poised for continued success. Despite the market's vigorous ascent in early 2024, investors must remember the inherent volatility of cryptocurrencies, marked by periodic drawdowns within bull markets. Yet, by maintaining a long-term view, we believe it becomes evident that Bitcoin is in a strong position.