After nearly breaching all-time highs in 2024 Q1, the total crypto market cap returned some of those gains in Q2, dropping -14.4%, closing at $2.43 trillion in June.
2024 Q2 brought Bitcoin’s long-anticipated fourth halving, which went off without a hitch. Each halving ushers in what crypto natives consider a new era, though the market response to the event was largely muted. After the exuberance in Q1 following the approval of the US spot Bitcoin ETFs, Q2 proved to be pretty choppy for Bitcoin and the crypto market as a whole.
But that doesn’t mean it wasn’t an eventful quarter.
Our comprehensive 2024 Q2 Crypto Industry Report covers everything from the crypto market landscape to analyzing Bitcoin and Ethereum, deep diving into the decentralized finance (DeFi) and non-fungible token (NFT) ecosystems, and reviewing how centralized exchanges (CEX) and decentralized exchanges (DEX) have performed.
We’ve summarized the key highlights, but be sure to dig into the full 51 slides below.
Top 7 Highlights of CoinGecko’s 2024 Q2 Crypto Industry Report
- Total crypto market capitalization dropped -14.4% in 2024 Q2, outperformed by the S&P 500 (+3.9%)
- Bitcoin fell -11.9% in 2024 Q2, ranging between $58k - $72k, just below its all-time high of $73k
- Bitcoin mining hash rate declined -18.8% in 2024 Q2, its first quarterly decline since 2022 Q2
- The top 15 CoinGecko categories in 2024 Q2 were Meme Coins, AI and RWA, accounting for 77.5% of web traffic
- Ethereum added 120.8K ETH to its supply, as emissions outpaced burns
- Spot trading volume on centralized exchanges (CEX) hit $3.40T in 2024 Q2, a drop of -12.2% from 2024 Q1.
- Spot trading volume on decentralized exchanges increased +15.7% to hit $370.70B, due to a surge in meme coins and airdrops.
1. Total Crypto Market Cap Fell -14.4% in 2024 Q2, Outperformed by The S&P 500 (+3.9%)
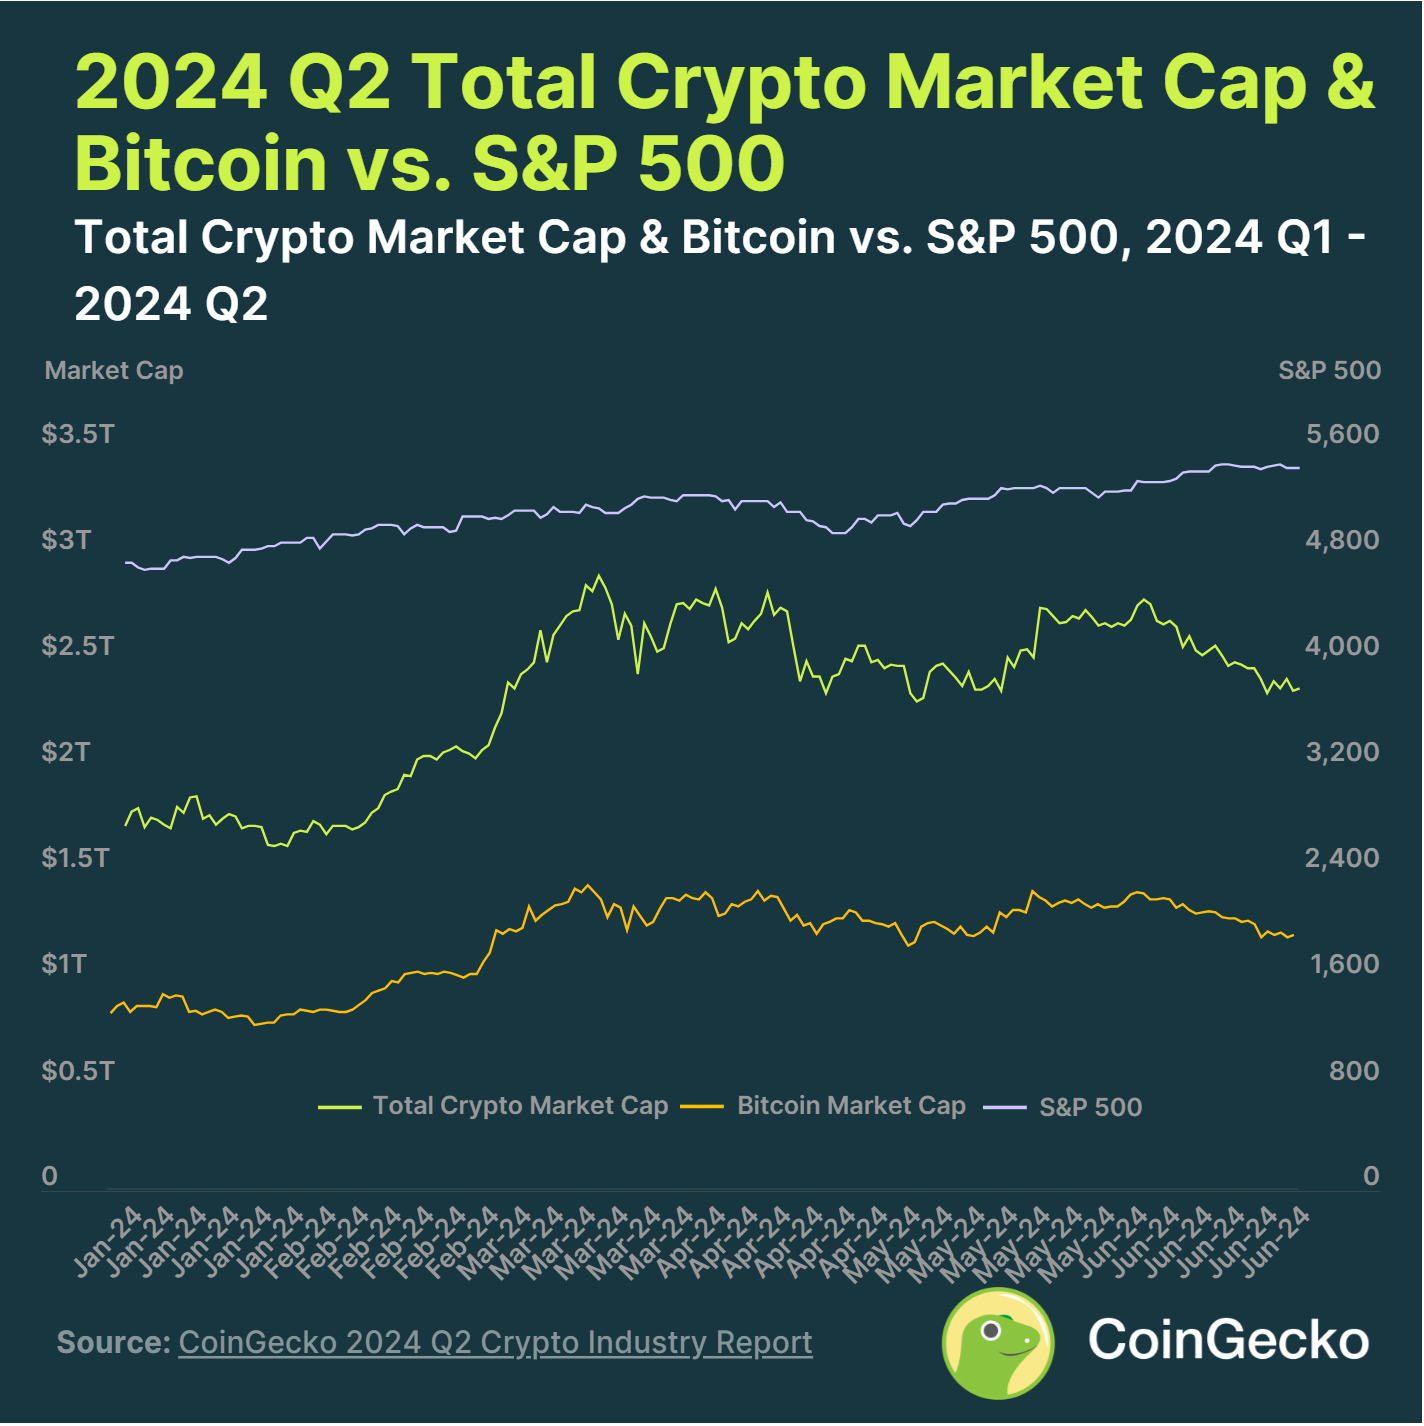
Total crypto market cap dropped -14.4% ($408.8 billion) to end 2024 Q2 at $2.43 trillion. The market had been oscillating within the $2.30 trillion - $2.90 trillion range, unable to make new all-time highs.
Meanwhile, the S&P 500 continued its upward climb, ending 2024 Q2 up +3.9%. This led to the correlation between total crypto market cap and the S&P 500 to plummet to 0.16 in Q2, from 0.84 in Q1.
Crypto volatility remained high in Q2, with the total crypto market cap at an annualized volatility of 48.2%, while Bitcoin stood at 46.7%. The S&P 500 had an almost fourfold lower volatility of 12.7%.
2. Bitcoin Ended 2024 Q2 at $62,734, Down -11.9%
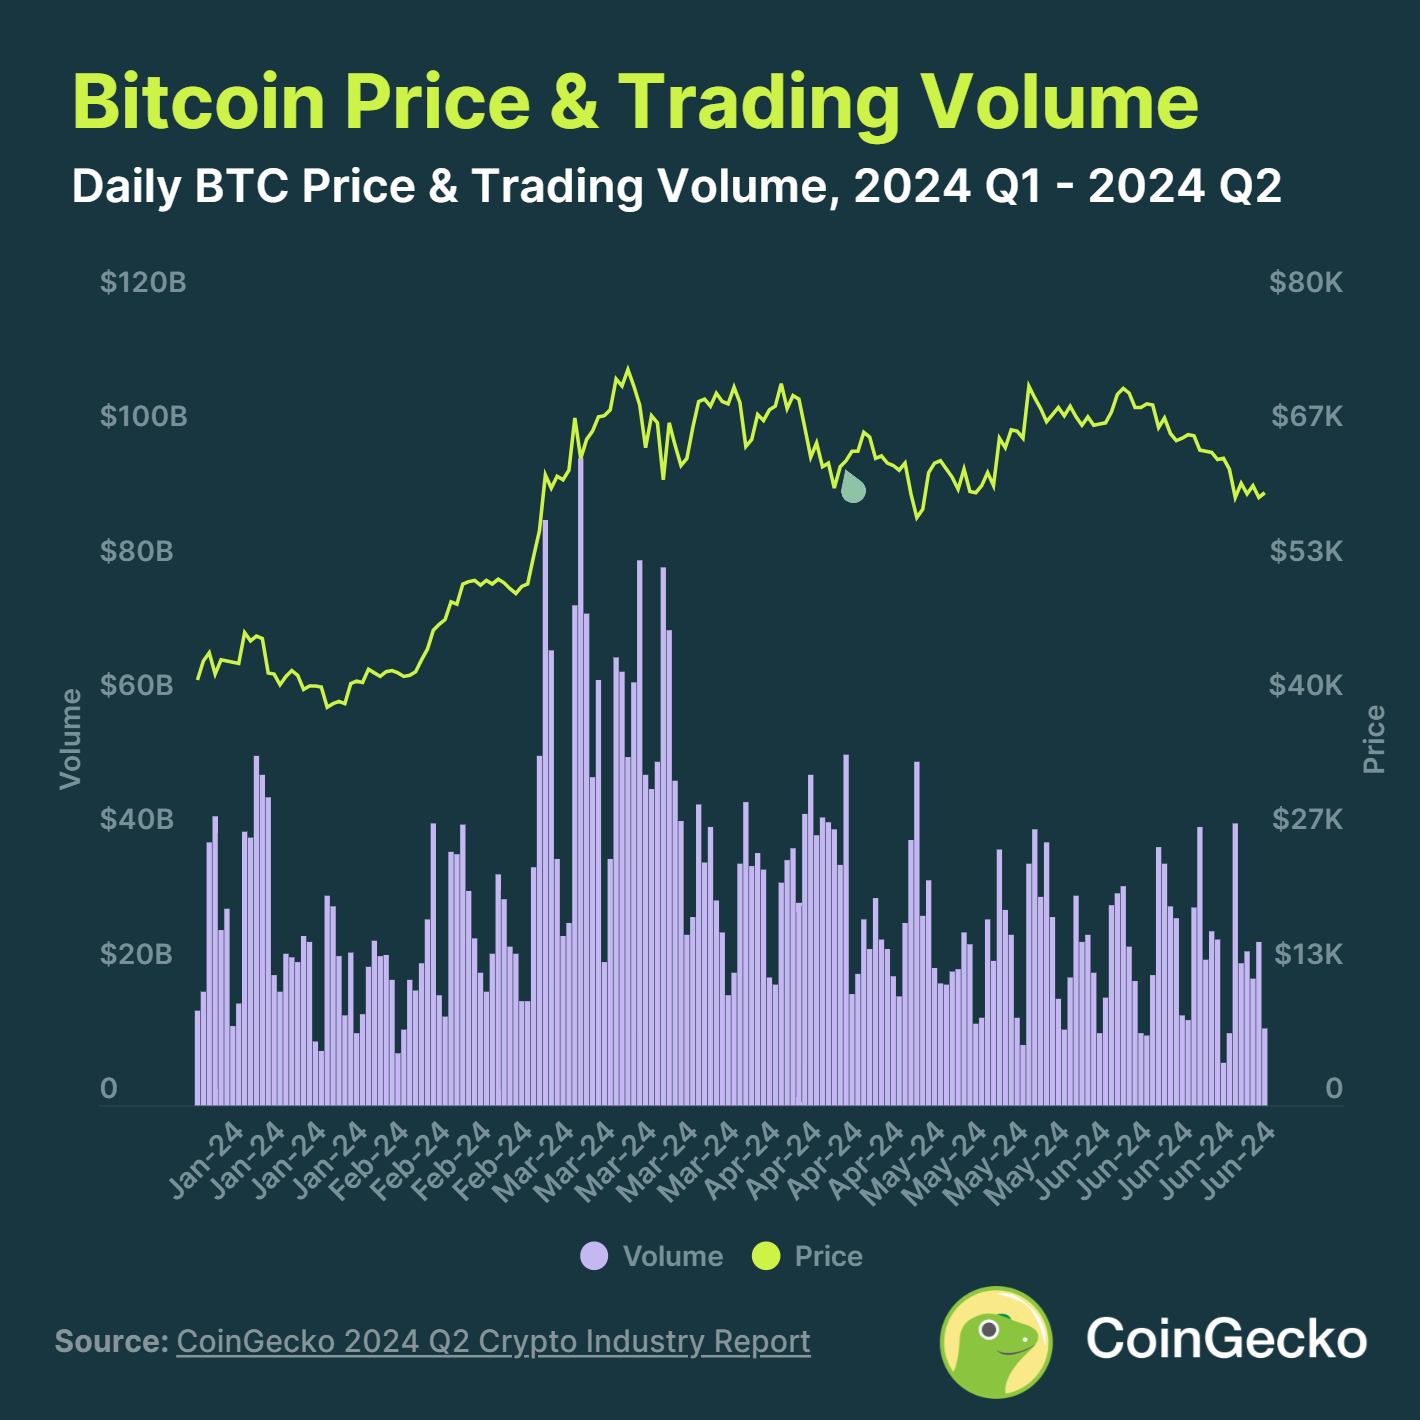
After Bitcoin hit a new all-time-high of $73,098 in mid-March, it oscillated between the $58,000 - $72,000 levels. Ultimately, it ended the quarter with a -11.9% decline, with the fourth bitcoin halving not having any notable impact on price.
Bitcoin trading volume also declined throughout 2024 Q2 to a daily average of $26.6 billion, a -21.6% decline from the previous quarter.
The quarter ended with market participants being spooked after being alerted that Mt Gox started moving its stash of 140K BTC, while the German government started selling its stash of seized Bitcoin.
3. Bitcoin Mining Hash Rate Hit ATH, Before Dropping -18.8%
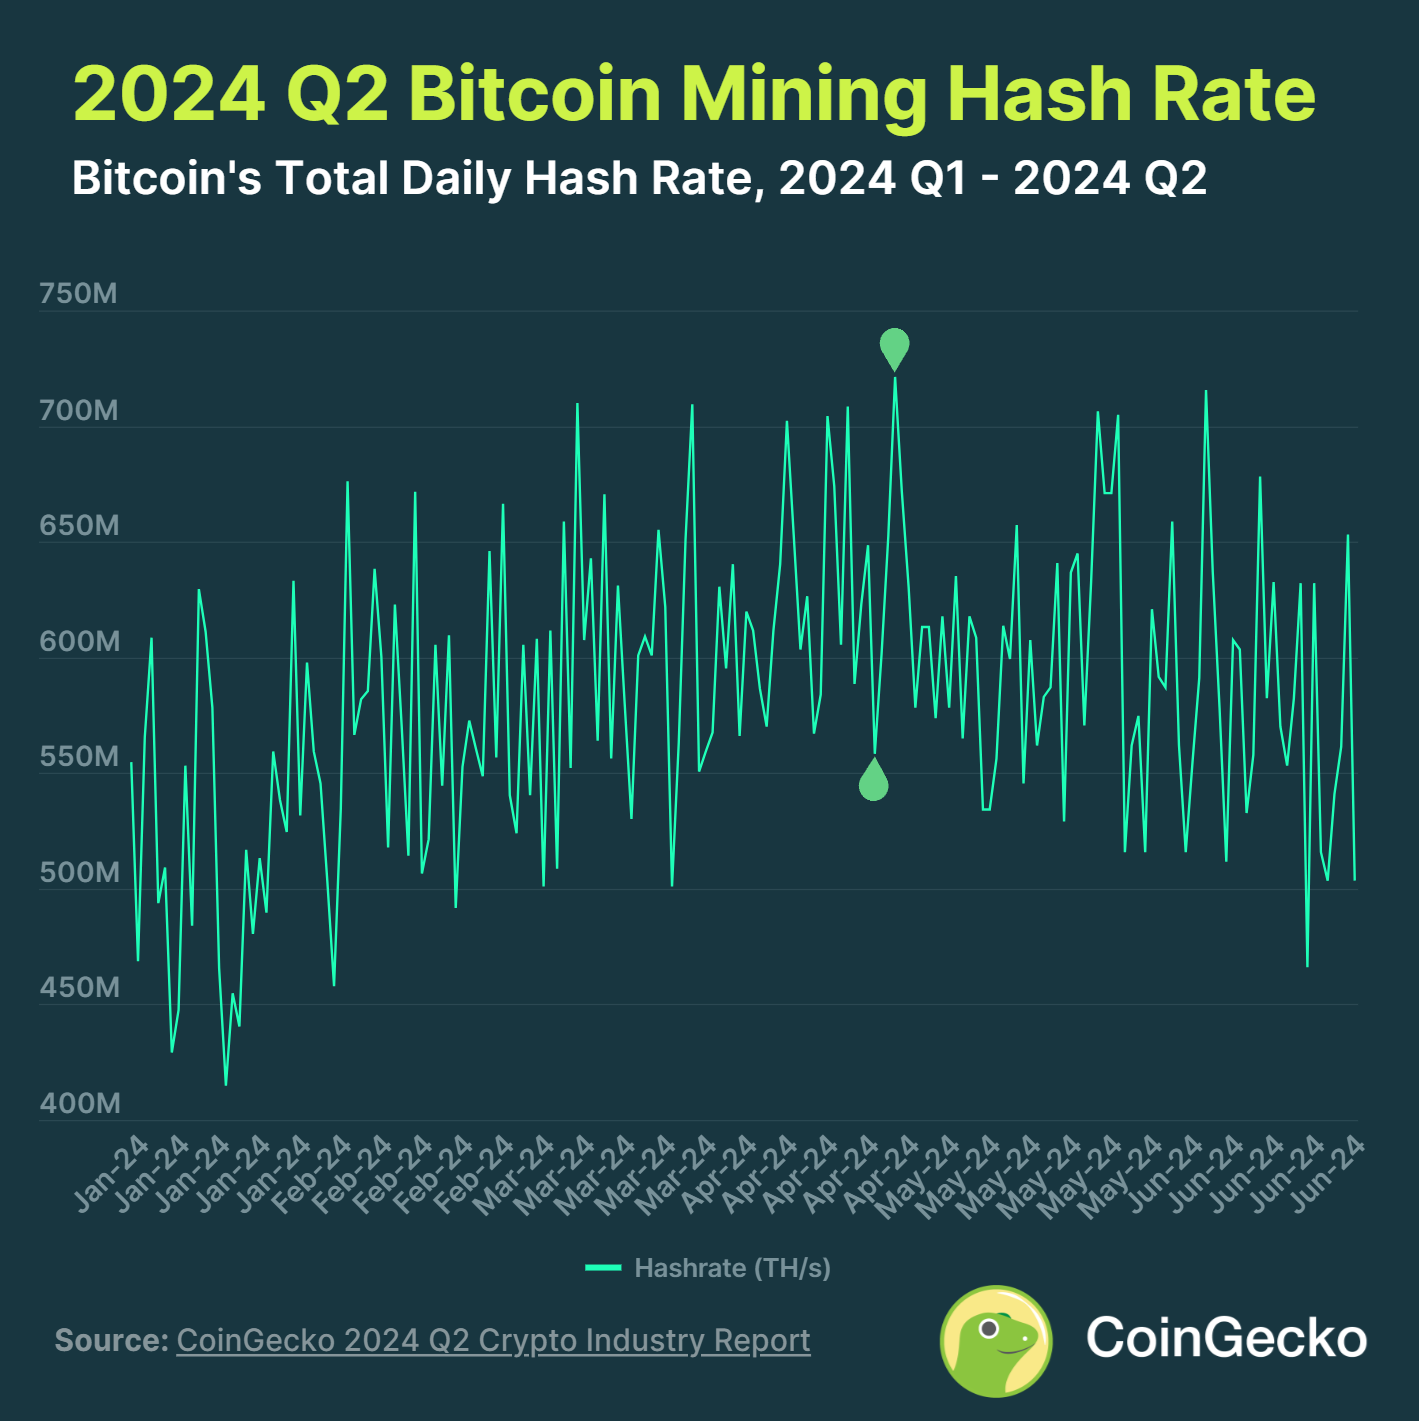
Bitcoin mining total hash rate fell by -18.8% in 2024 Q2, after reaching an all-time high of 721M TH/s on April 23, 2024. This marks the first down quarter for bitcoin’s hash rate since 2022 Q2.
Despite the drop in mining hash rate, the industry has seen a flurry of developments. Companies such as BitDigital, Hive, Hut 8, Terawulf, and Core Scientific expanded or are looking to expand into AI. Meanwhile, Tether announced a $500 million investment into the mining sector, and Block finished development of its 3nm mining chip.
4. Meme Coins Were the Most Popular Narrative in 2024 Q2, Accounting for 14.3% Market Share
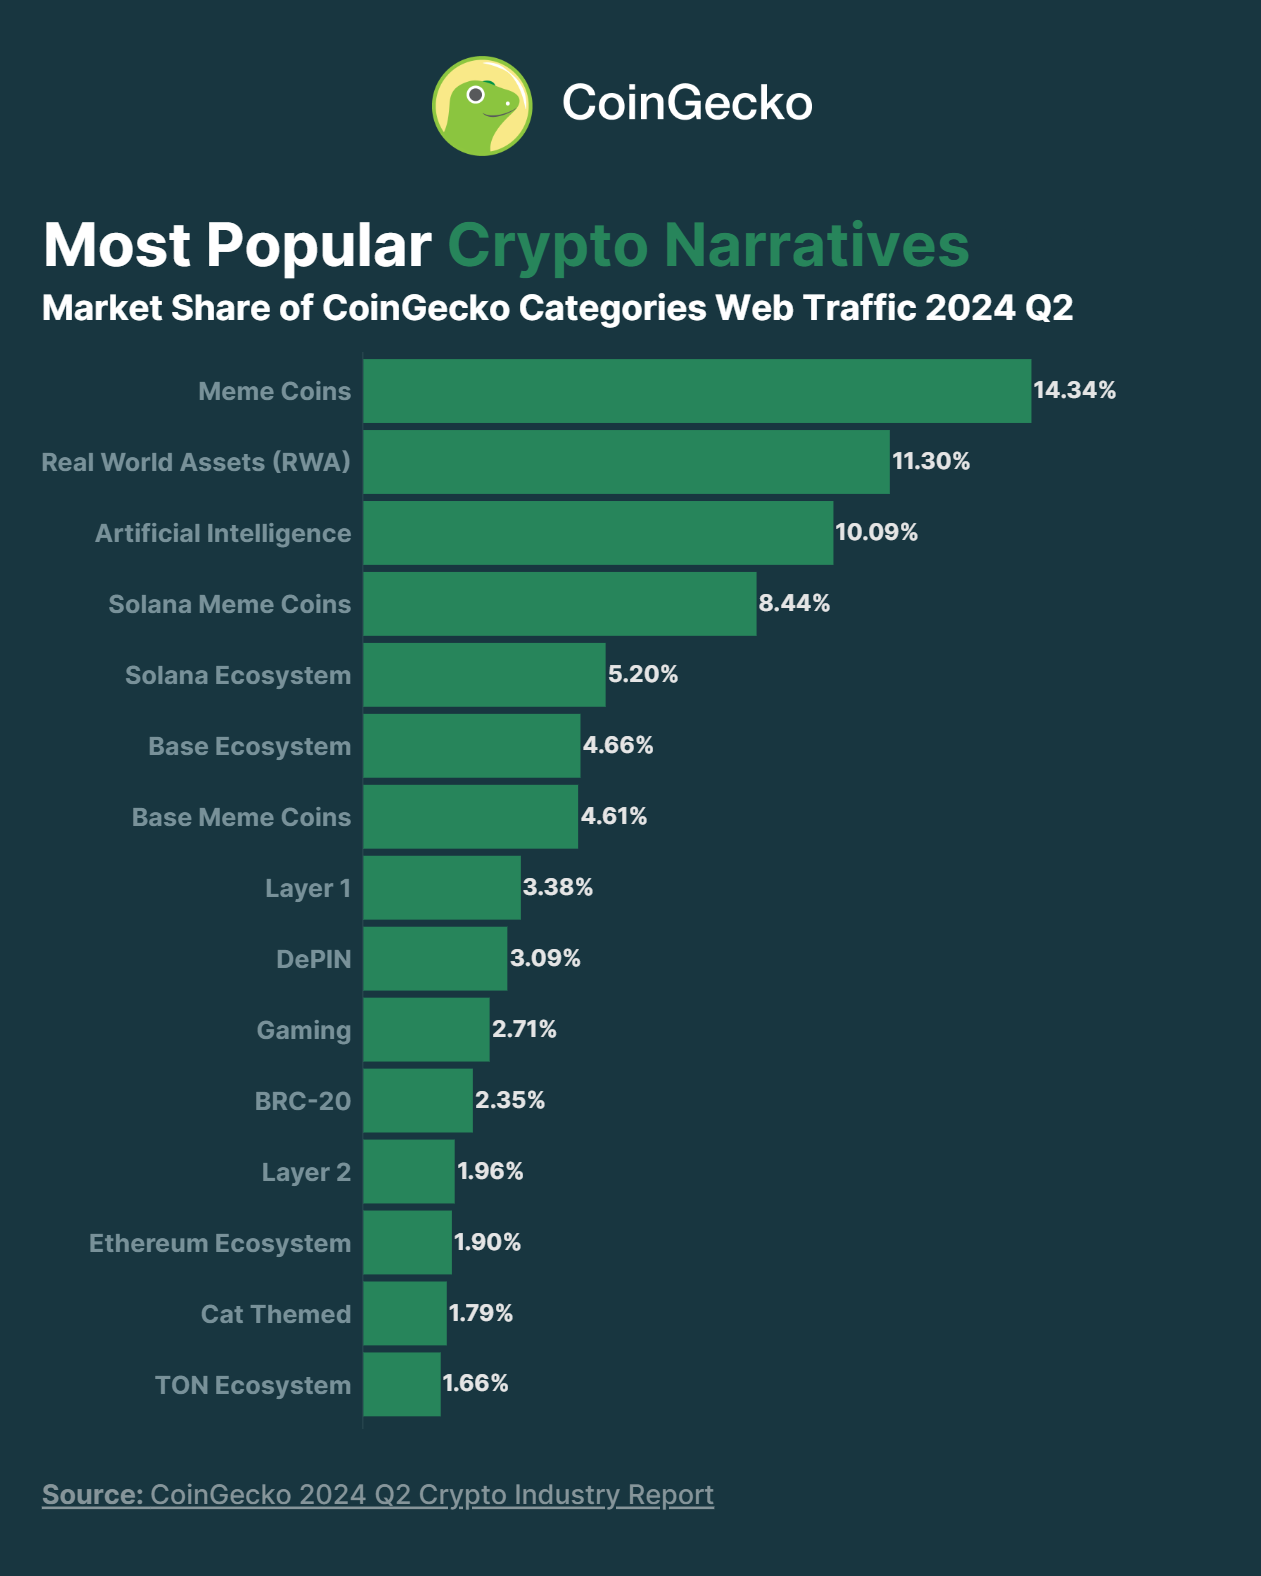
Meme Coins, Real World Assets (RWA), and Artificial Intelligence (AI) were the most popular narratives in 2024 Q2, capturing 35.7% of market share. This was similar to 2024 Q1.
Meme coins dominated the chart, with 4 of the top 15 most popular crypto narratives being meme coin related. Meanwhile, 4 out of 49 blockchain ecosystems, Solana, Ethereum, Base, and TON made it into the top 15 crypto narratives. Solana and Base were the most popular ecosystems, capturing 22.9% share of market attention.
5. Ethereum Turned Inflationary, Adding 120K ETH to Circulating Supply
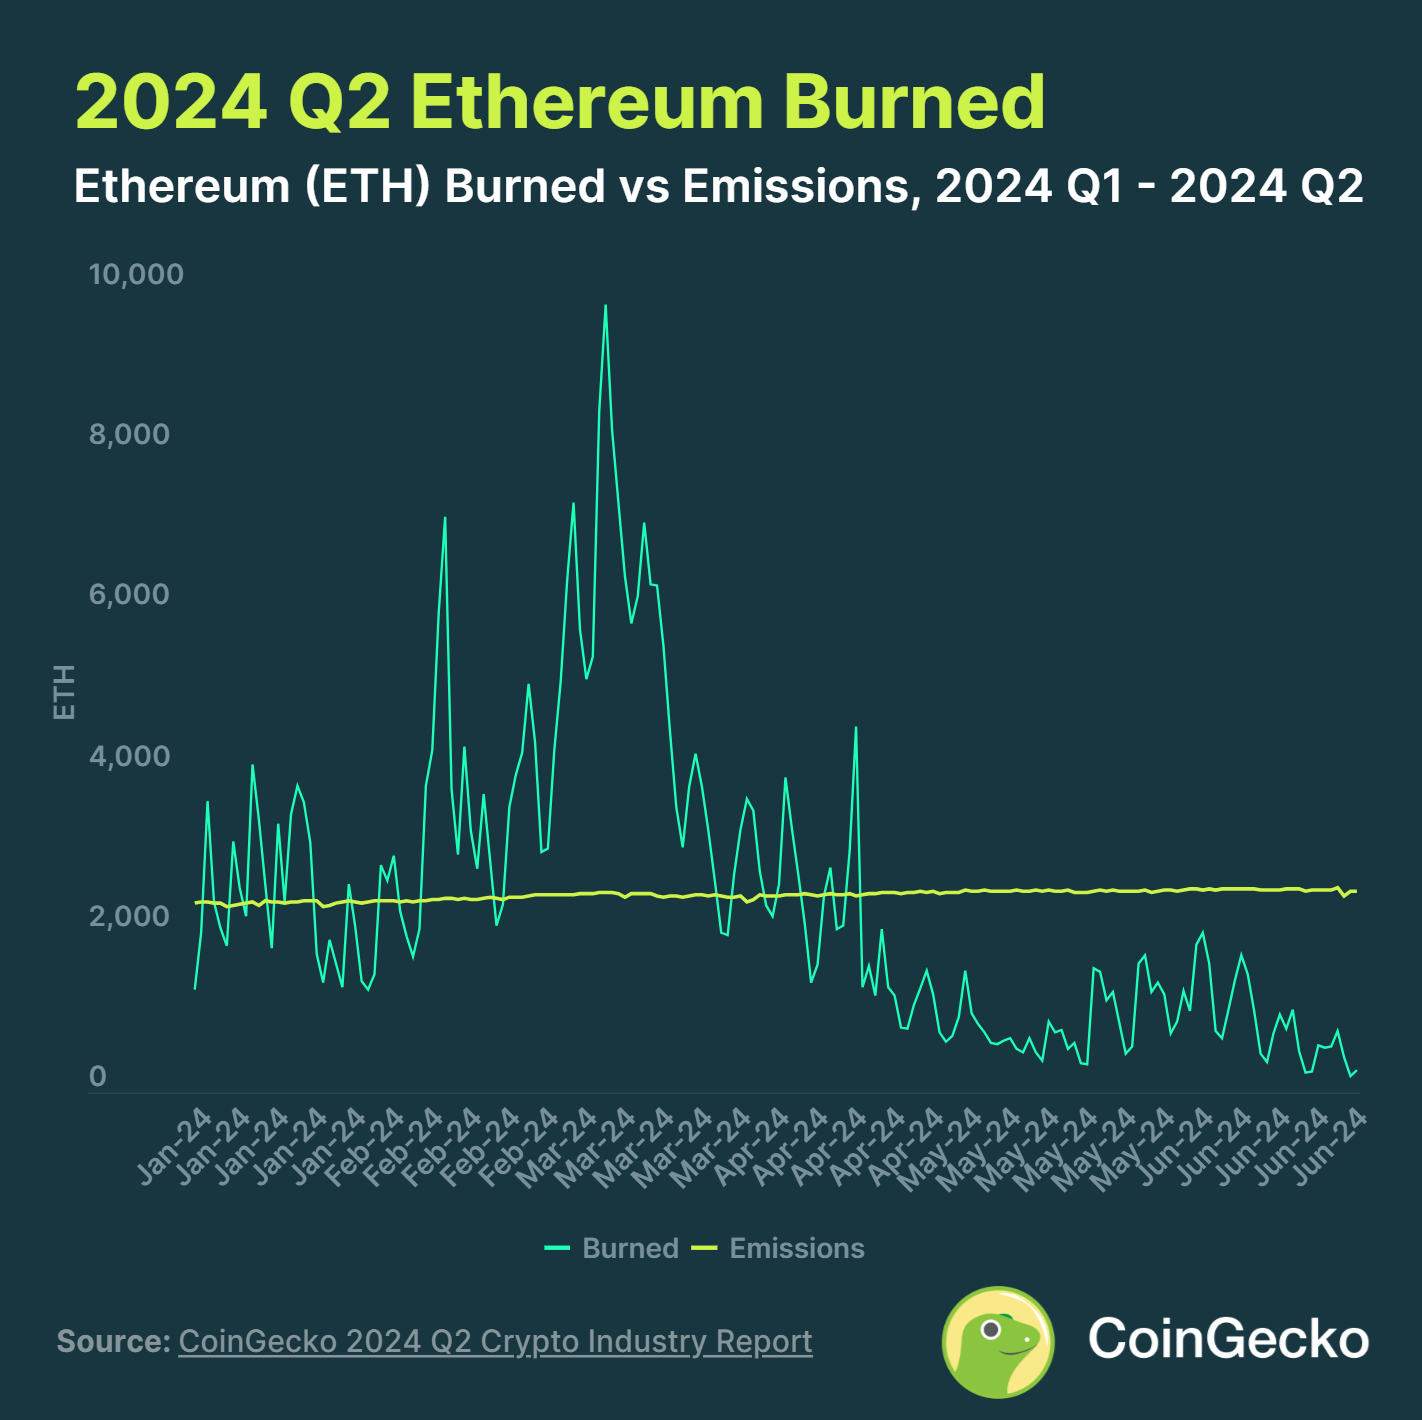
107,725 ETH were burned, while 228,543 were emitted in 2024 Q2, making the network inflationary during the past quarter. This led to a total of 120,818 ETH being added to the supply in Q2. The burn rate of ETH fell -66.7% Quarter-on-Quarter as network activity slowed and gas fees fell.
There were only 7 days in Q2 in which ETH burns exceeded emissions. In comparison, this figure stood at 66 days in Q1. The largest contributor to ETH burns was ETH Transfers, burning 6,838 ETH in Q2.
6. Spot Trading Volume on Centralized Exchanges Hit $3.40T in 2024 Q2, Down -12.2% QoQ
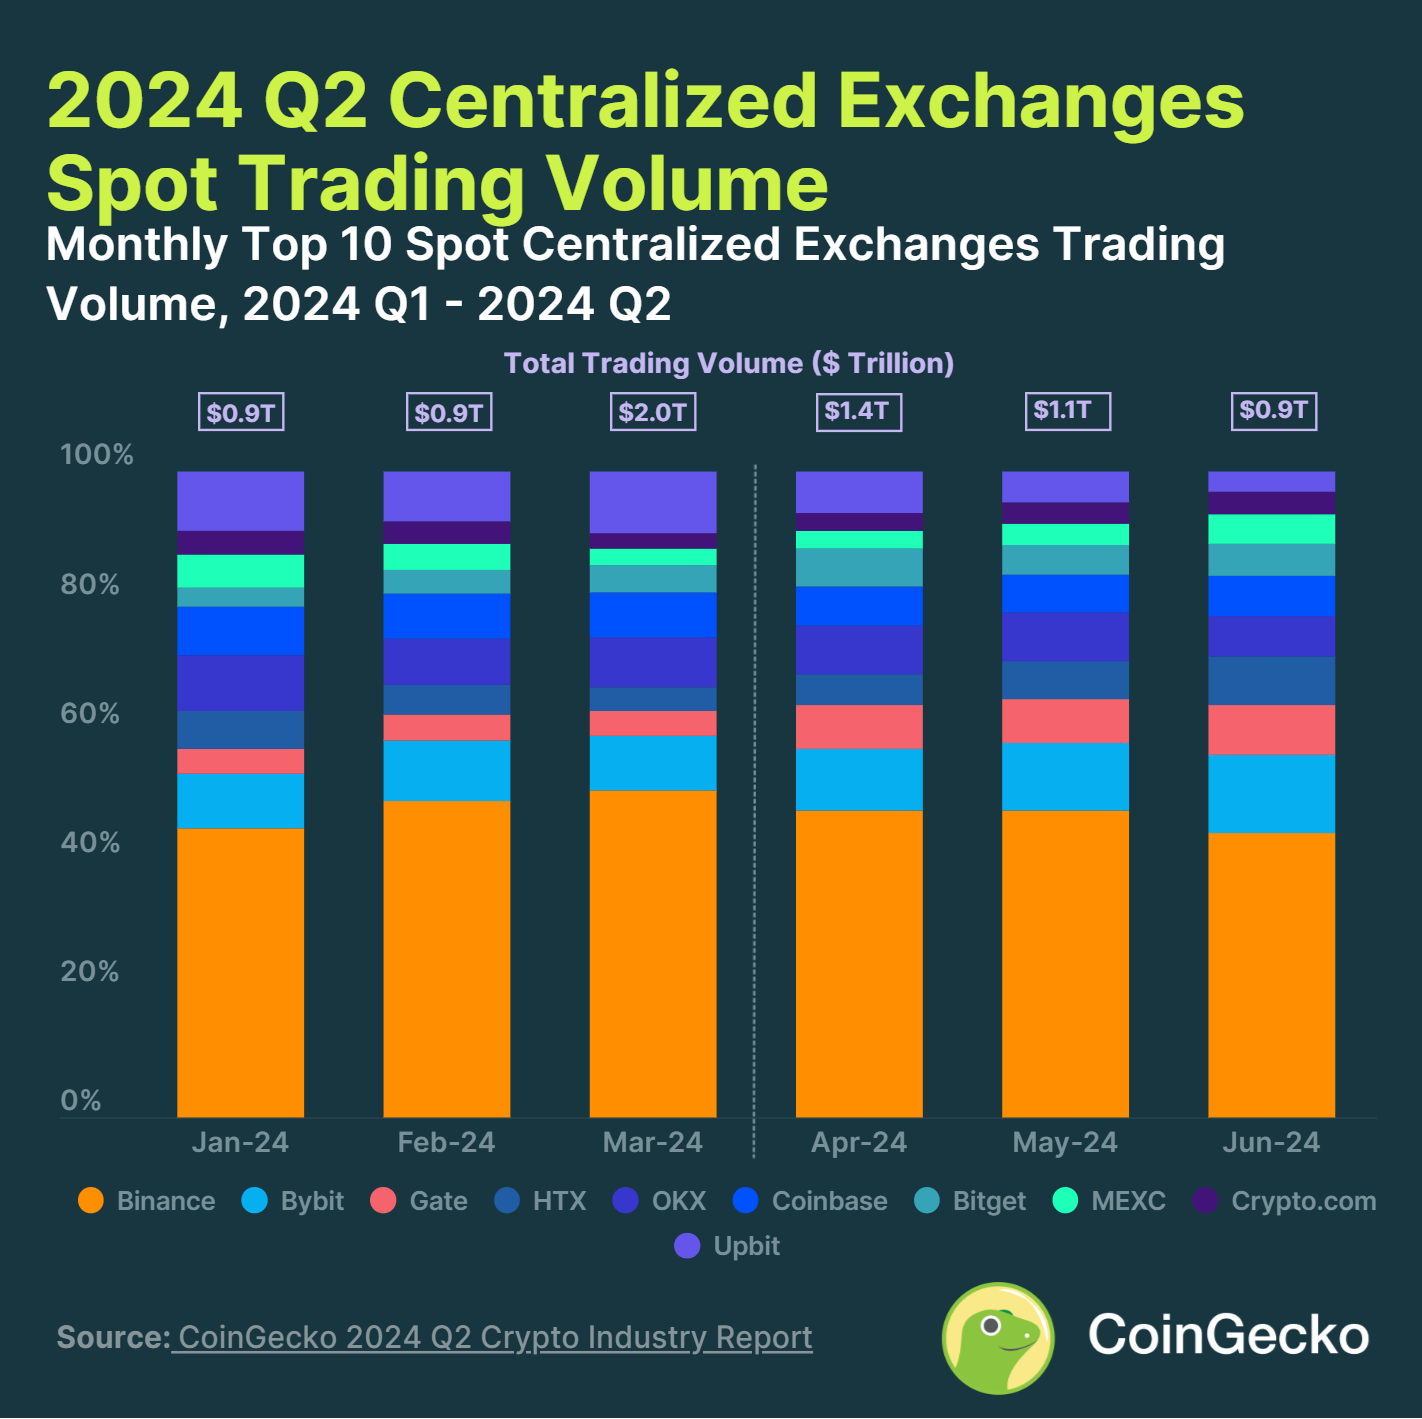
In 2024 Q2, the top 10 centralized exchanges (CEX’s) recorded $3.40 trillion in spot trading volume. This represents a drop of -12.2% quarter-on-quarter (QoQ), in line with the overall crypto market performance.
Binance remained the largest CEX, ending June 2024 with a market share of 45% despite a slump in trading volume. Meanwhile, Bybit surged to become the second-largest spot CEX in Q2, overtaking Upbit. It increased its market share to 12.6% in June.
Only 4 of the top 10 spot CEXes had an increase in trading volume, with Gate climbing the most at 51.1% ($85.2B), Bitget at 15.4% ($24.7B), and HTX growing 13.7% ($25.5B). During the same period, there was a noticeable increase in new listings and project launches on the exchange.
7. Decentralized Exchanges Hit $370.7B in Trading Volume, up +15.7% QoQ
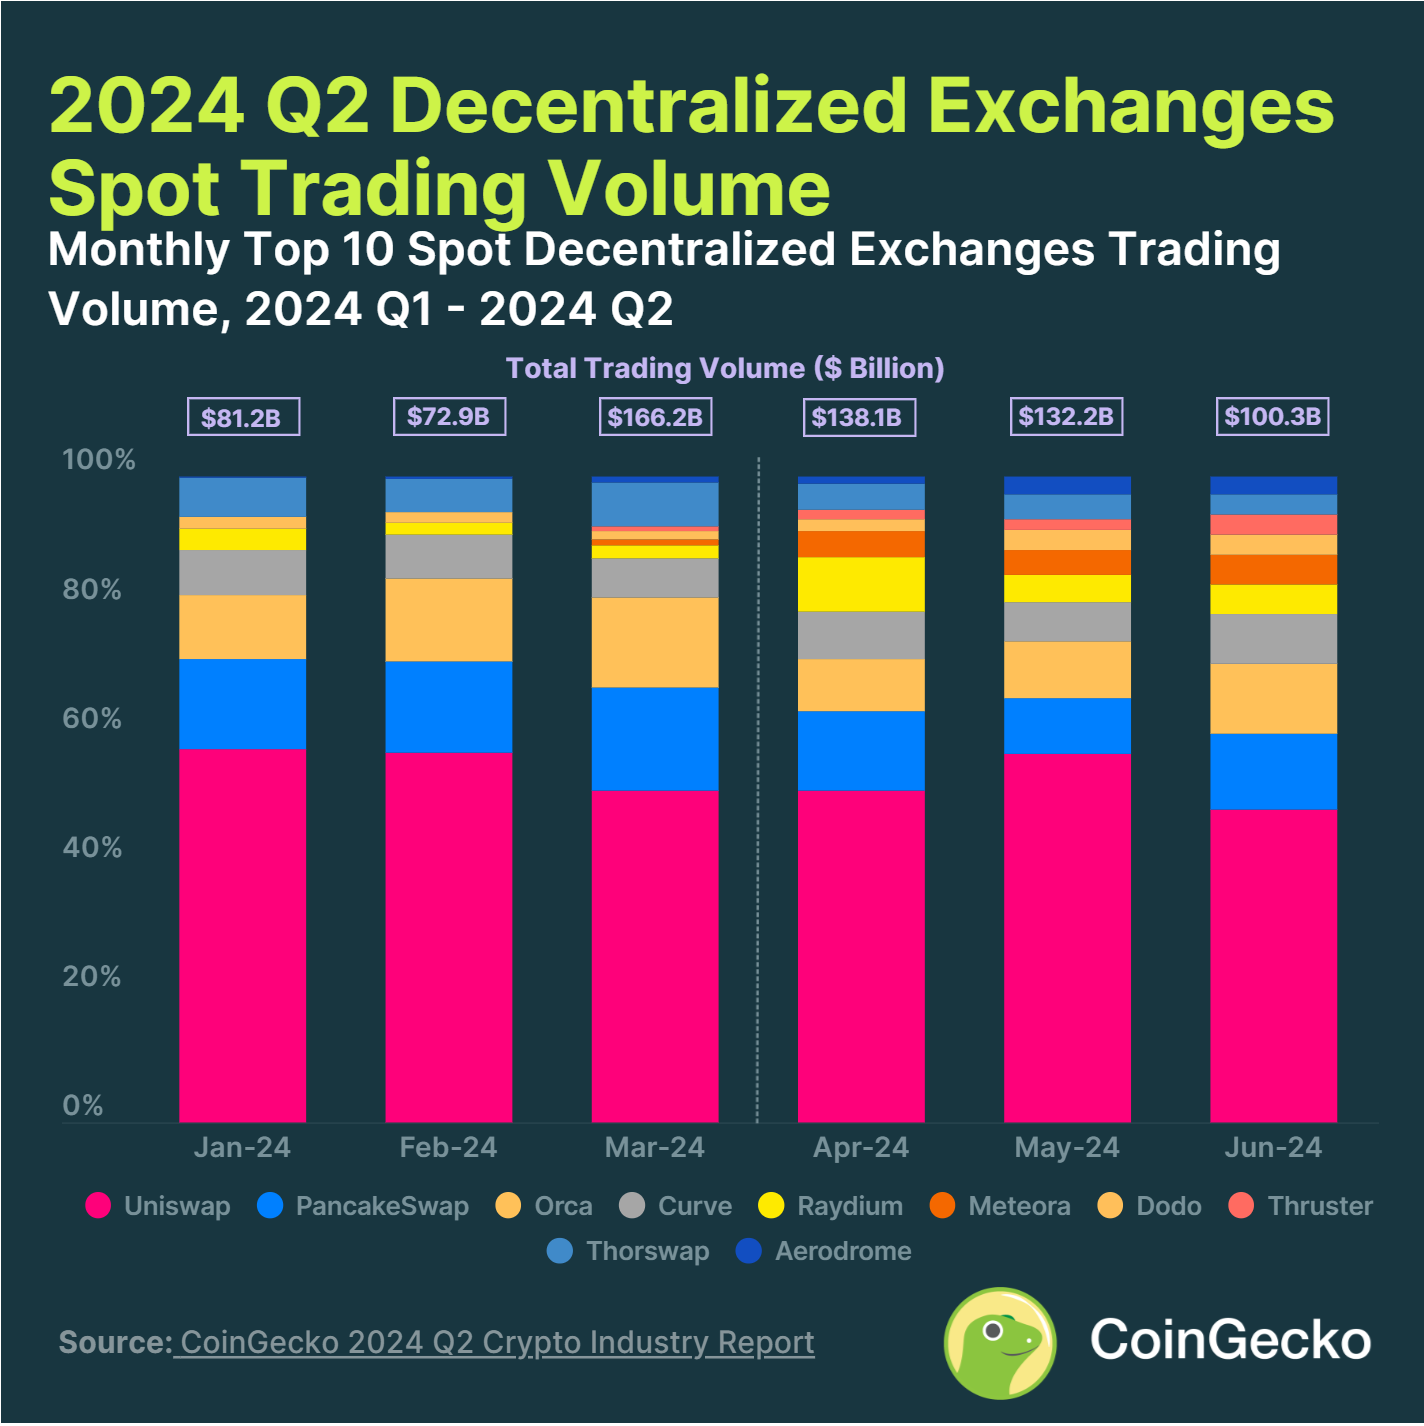
In 2024 Q2, the top 10 decentralized exchanges (DEX’s) recorded $370.7 billion in spot trading volume. This represents an increase of +15.7% quarter-on-quarter (QoQ), with DEXes having benefited from a surge in meme coins and the many airdrops throughout Q2.
Uniswap remained the dominant DEX, ending June 2024 with a 48% market share. However, DEXes in the bottom rungs of the top 10 have been challenged by the likes of Thruster and Aerodrome. Thruster, native to Blast, saw volumes rise 464.4% ($6.0 billion) QoQ, ending June with a 3% market share. It was the largest gainer in Q2. Meanwhile, Aerodrome was the second largest gainer, growing 297.4% ($5.9 billion), entering the top 10 with a 3% market share. Thruster benefited from Blasts points farming, while Aerodrome had a surge in meme coins trading on Base.