

The fourth Bitcoin Halving is now a little over a month away. As with all prior halvings, it will reduce bitcoin issuance rewards for miners by half – this time from 6.25 BTC per block to 3.125 BTC. Although studying past halving cycles can offer some insight into bitcoin’s potential price action, we think the small sample size of three events may not provide enough data points to identify clear patterns or make definitive predictions about the impact of upcoming halvings.
Moreover, we believe that bitcoin’s market dynamics have fundamentally changed with the advent of US spot BTC ETFs. Their multi-billion dollar net inflows in just two months have irrevocably altered the landscape. With major institutional players now capable of taking exposure through these vehicles, bitcoin's response to the upcoming halving may not necessarily mirror its performance in prior cycles. We think it’s more important to understand the current technical supply vs demand setup to better understand bitcoin’s performance potential.
Indeed, restrictions in new bitcoin supply are just one factor to consider, albeit an important one. Bitcoin available to trade (i.e. the difference between circulating and illiquid supply) has been in decline since early 2020, a major shift from previous cycles. But recent data suggests that there has been a substantive 1.3M increase in active BTC supply (bitcoin moved within the past 3 months) since early 4Q23, compared to only ~150k new BTC mined during that time. Although the market is better positioned than in the past to absorb this supply, we think it’s still prudent not to oversimplify the complex interplay between these market dynamics.
Background
The halving of bitcoin miner rewards takes place each time an additional 210,000 blocks are mined, which happens roughly every four years. (The exact date and time depends on the network hashrate – i.e. the computing power applied to processing transactions and mining new blocks – but is estimated to occur sometime between April 16-20 this year.) This event will reduce the total amount of bitcoin issued from ~900 bitcoin per day (representing an annual issuance rate of 1.8%) to ~450 bitcoin per day (or 0.9%). That’s roughly 13,500 new bitcoin that will be added to the total supply per month or 164,250 per year (though precise numbers depend on the actual hashrate).
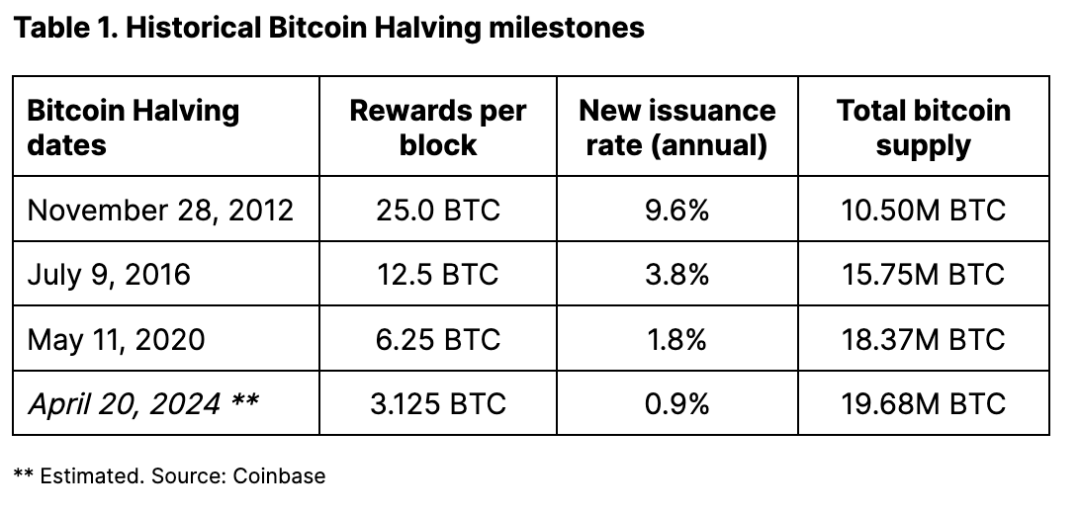
Halvings continue to take place on the same schedule until all 21 million bitcoin have been mined, which is estimated to happen sometime around the year 2140. We believe the halving’s underlying significance lies in its ability to raise media attention around what makes bitcoin unique: a fixed, disinflationary supply schedule that culminates in a hard cap.
This point often goes underappreciated. For physical commodities, additional resources can theoretically be applied to mine and extract more gold or copper (for example), helping to meet demand when prices rise, even if the thresholds may be high. But bitcoin supply is inelastic (i.e. insensitive to price) due to the preset block rewards and the difficulty-adjustment mechanism. Moreover, bitcoin is a growth story. The utility of the Bitcoin network expands in relation to the number of users on the network, which directly contributes to the value of the token. Comparatively, there are no growth aspirations for buying precious metals like gold.
History doesn't repeat itself, but…
Parsing the impact of halving cycles on bitcoin performance is limited by the fact that our experience is relegated to only three events. As such, studies of the correlation between prior halving events and bitcoin price should be interpreted cautiously, as the small sample size makes it difficult to generalize patterns from historical analysis alone. Indeed, we think more halving cycles will be needed to draw stronger conclusions about how bitcoin “typically” responds. Moreover, correlation does not imply causation, and factors including market sentiment, adoption trends, and macroeconomic conditions can contribute to price movements.
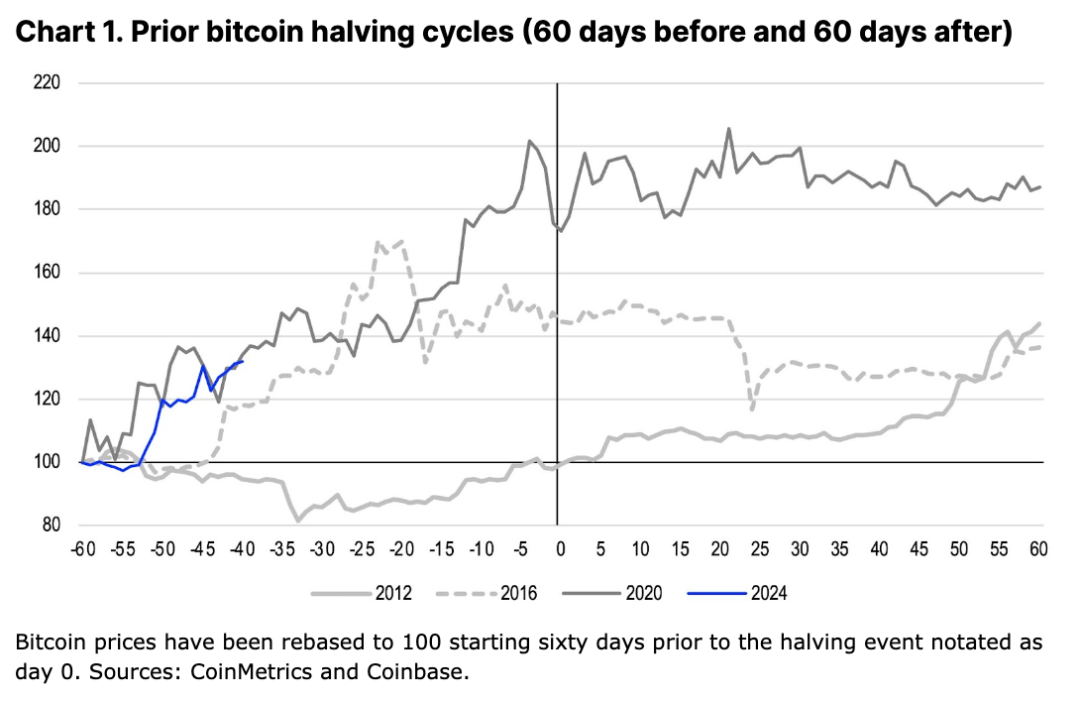
In fact, we’ve previously argued that the performance of bitcoin around previous halving events was most likely context dependent. That may explain why price trends during different cycles have varied so widely, as seen in Chart 1. For example, bitcoin prices were relatively flat in the 60 days prior to the first halving in November 2012, whereas bitcoin had already appreciated 45% and 73% respectively in the same period before the second and third halvings in July 2016 and May 2020.
In our view, the beneficial effects of the first halving weren’t truly evident until January 2013, when the impact of the Federal Reserve’s quantitative easing program (QE3) intersected with the US debt ceiling crisis. We think increased media coverage of the halving likely heightened awareness of bitcoin's role as an alternative store of value relative to popular concerns over monetary debasement. Comparatively, in 2016, Brexit may have stoked fiscal concerns in the UK and Europe, representing a possible catalyst for bitcoin buying. This was then sustained by the Initial Coin Offering (ICO) boom that carried over into 2017. In early 2020, global central banks and governments responded to the COVID-19 pandemic with unprecedented levels of stimulus, driving liquidity sharply higher.
It's important to note too, that analyses of historical performance can vary significantly depending on the periods under observation relative to halving events. Price return metrics can change based on whether the analysis looks at periods starting (and ending) 30, 60, 90 or 120 days from the halving date. Using different windows may thus impact conclusions drawn from past price behavior. For our purposes, we use a 60-day period as it both helps filter out short-term noise but is not so far removed from the halving that other market factors could begin to dominate price drivers over the longer term.
ETFs: The secret of getting ahead is getting started
US spot bitcoin ETFs are reshaping bitcoin's market dynamics by establishing a new anchor for BTC demand. In previous cycles, liquidity has represented the main setback to upward price momentum as key market participants (including but not limited to bitcoin miners) would drive sell-offs in their attempt to exit long positions.
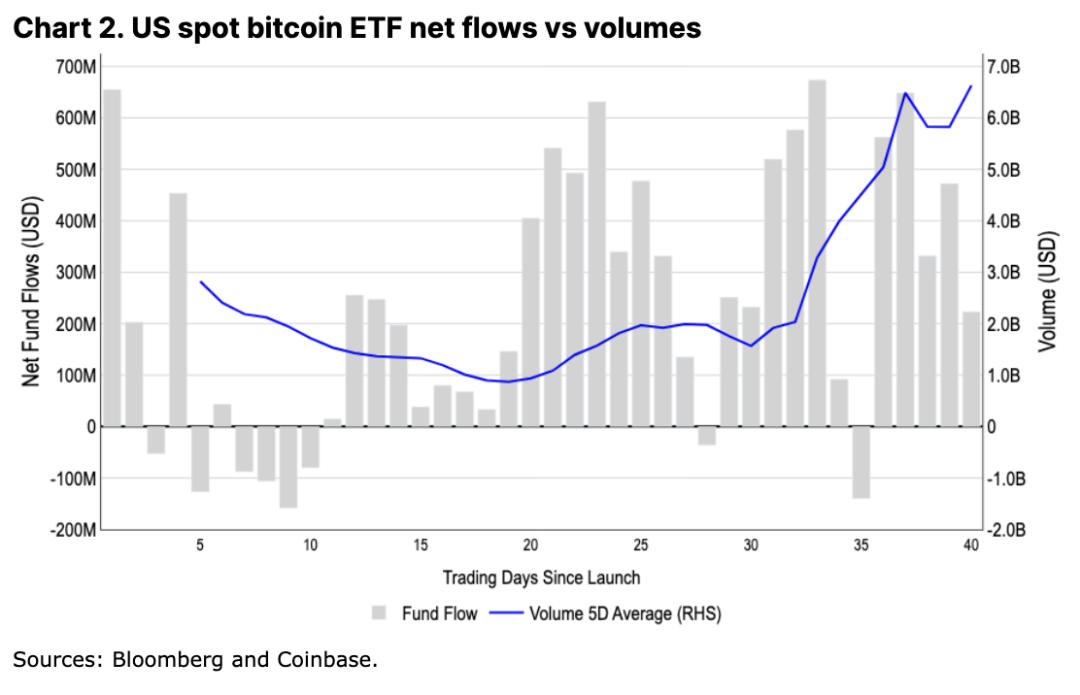
Today, ETF inflows promise to absorb much of that supply in a gradual, sustained manner. Indeed, ETFs now represent around $4-5B in average daily BTC spot volumes (or 15-20% of the total across centralized exchanges globally), making liquidity sufficiently large for institutions to trade in this space. This stable demand profile could be positive for bitcoin's price over the long run by creating a more balanced market with less volatility from concentrated selling.
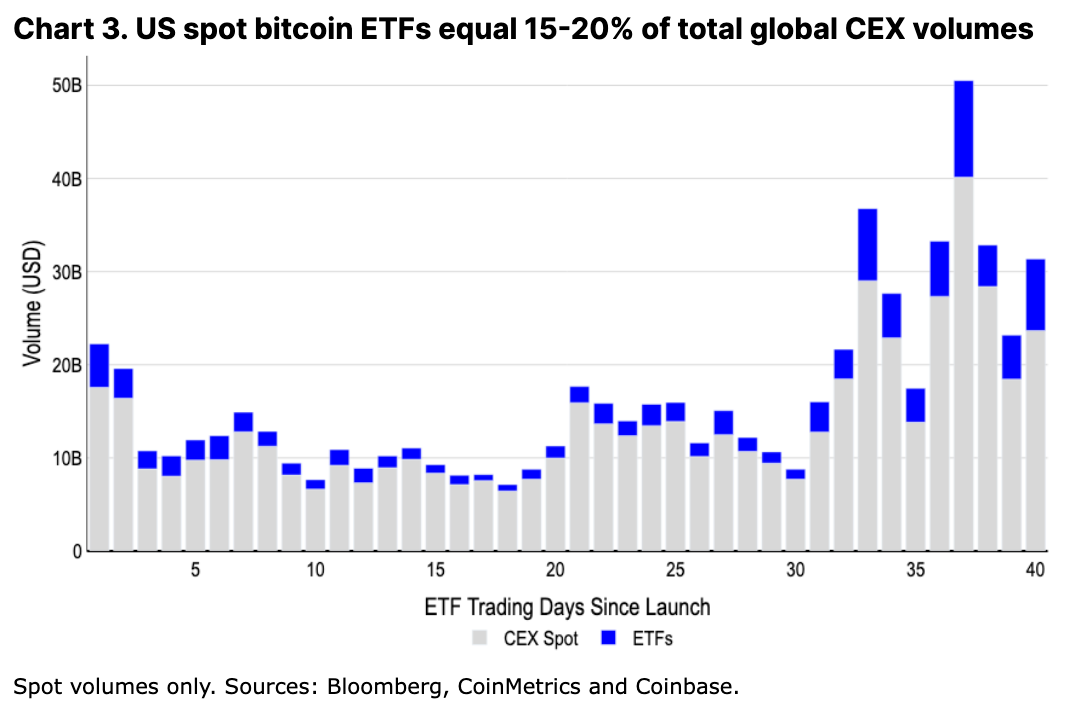
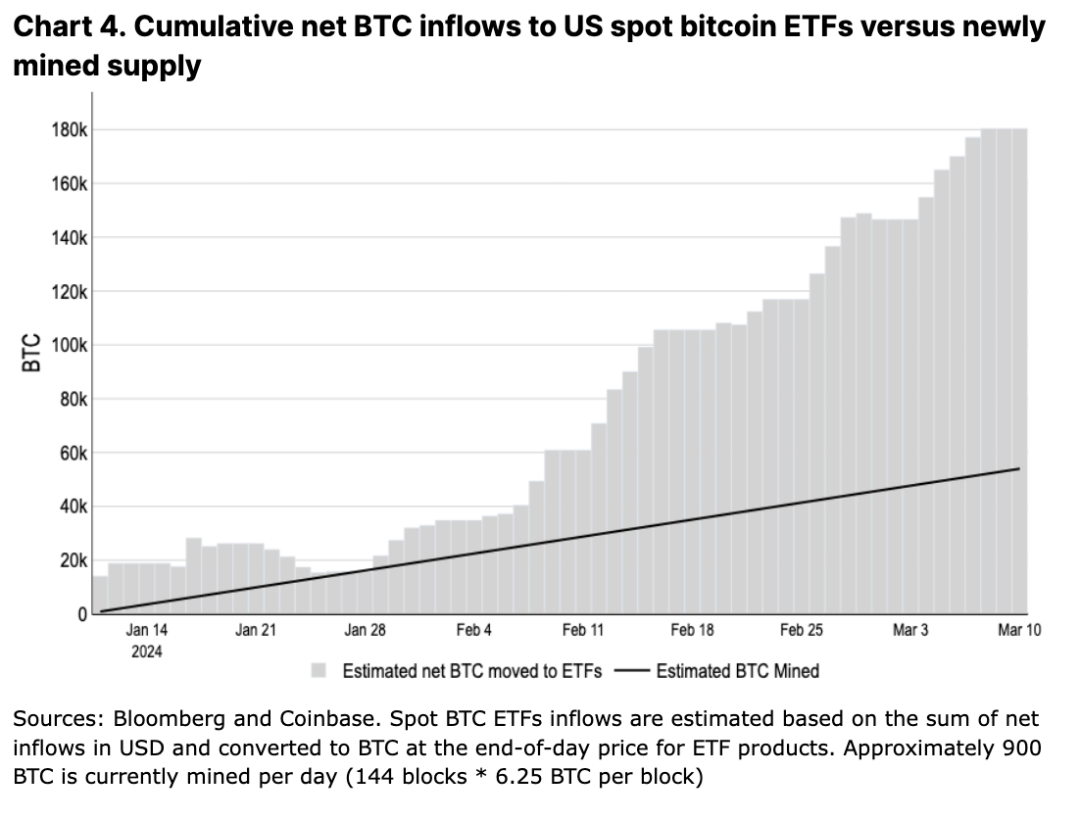
Already, US spot bitcoin ETFs have attracted $9.6B of net inflows in their first two months with total assets under management amounting to $55B. That means that the cumulative net growth in BTC held by these ETFs (180k BTC) has outpaced the new bitcoin supply generated by miners (55k BTC) by nearly threefold in that time frame (see Chart 3). If we look at all spot bitcoin ETFs globally, these regulated investment vehicles currently hold around 1.1M bitcoin or 5.8% of total circulating supply, according to Bloomberg.
Over the medium-term, we could see ETFs sustain if not potentially increase the current pace of flows, as large wirehouses haven’t even begun to offer these products to their clients yet. With more than $6T still sitting in US money market funds and interest rate cuts on the horizon, we think there is still a lot of sidelined capital that could make its way into this asset class in this year alone.
Incidentally, note that the potential concentration of bitcoin held by ETFs does not pose stability risks to the network, as merely owning bitcoin does not provide any influence over the decentralized network or control over its nodes. Moreover, financial institutions currently cannot yet offer derivatives based on these ETFs (as the underlying asset), which could change the market structure for large players when they become available. Regulatory approval for this may still be months away, if not longer.
Hypothetically, if we assumed that the pace of new inflows into US-based ETFs slowed from $6B in February to say a steady state of $1B of net inflows per month, a simple mental model suggests that measured against ~13.5k BTC mined per month (in a post-halving environment) the equilibrium price for bitcoin should be closer to around $74k. Of course, an obvious problem with this model is that bitcoin miners are not the only source of bitcoin supply selling into the market. Indeed, we think that the imbalance between newly mined bitcoin and ETF inflows is only a small part of the story behind longer-term cyclical supply trends.
Lies, damn lies and statistics
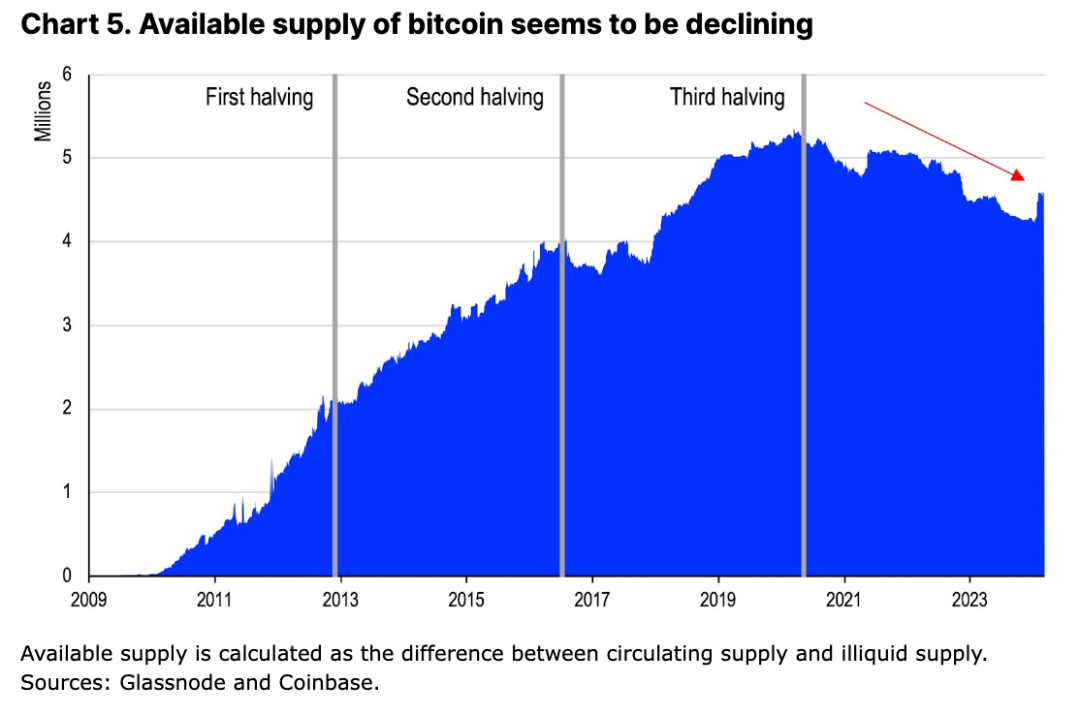
One way of measuring the bitcoin supply available for trading is to take the difference between (1) the token’s current circulating supply of 19.65M BTC and (2) the illiquid supply consisting of bitcoin that are largely unavailable for trading due to being in lost wallets, stuck in very long-term holdings, or otherwise locked up. Based on data from Glassnode, which classifies illiquid supply according to the cumulative inflows vs outflows over a given entity's lifespan, the level of available bitcoin supply has been trending lower over the last four years from a peak of 5.3M BTC in early 2020 to its current 4.6M BTC. This is a major shift away from the steadily rising trend (in available supply) that was observed during the previous three halvings (see Chart 5).
Prima facie, the decreasing availability of bitcoin for trading seems like a major pillar of technical support for bitcoin performance, given that we have new sources of institutional demand stemming from the ETFs. Indeed, given the imminent reduction in new bitcoin entering circulation, these supply and demand dynamics suggest that the potential for market tightness in the near term may be high. That said, we do not believe that this framework fully captures the complexity of liquidity dynamics in the bitcoin market, particularly as “illiquid supply” does not mean static supply.
In our view, investors should not overlook several key factors that may influence selling pressure:
- Not all illiquid bitcoin are “trapped.” Long-term holders (who hold their bitcoin for longer than 155 days and represent 83.5% of positions, according to Glassnode) may be less economically sensitive to their positions relative to short-term holders, but we expect that some contingent in this group may still look to realize gains during price rallies.
- Some holders may have no intention to sell in the near future, but could still provide liquidity by using their bitcoin as collateral. This limits how "illiquid" those coins truly are.
- Miners may sell their bitcoin reserves (currently 1.8M BTC across both public and private miners) to expand their operations or cover other costs.
- Short-term holdings of around 3M BTC are not small, and speculators may yet take profits as prices fluctuate.
By not accounting for these meaningful sources of supply, the narrative of inevitable scarcity due to reduced mining rewards and steady ETF demand is an oversimplification. In our view, a more comprehensive assessment is required to determine the true supply and demand dynamics at play around upcoming halving events.
Active supply vs flows
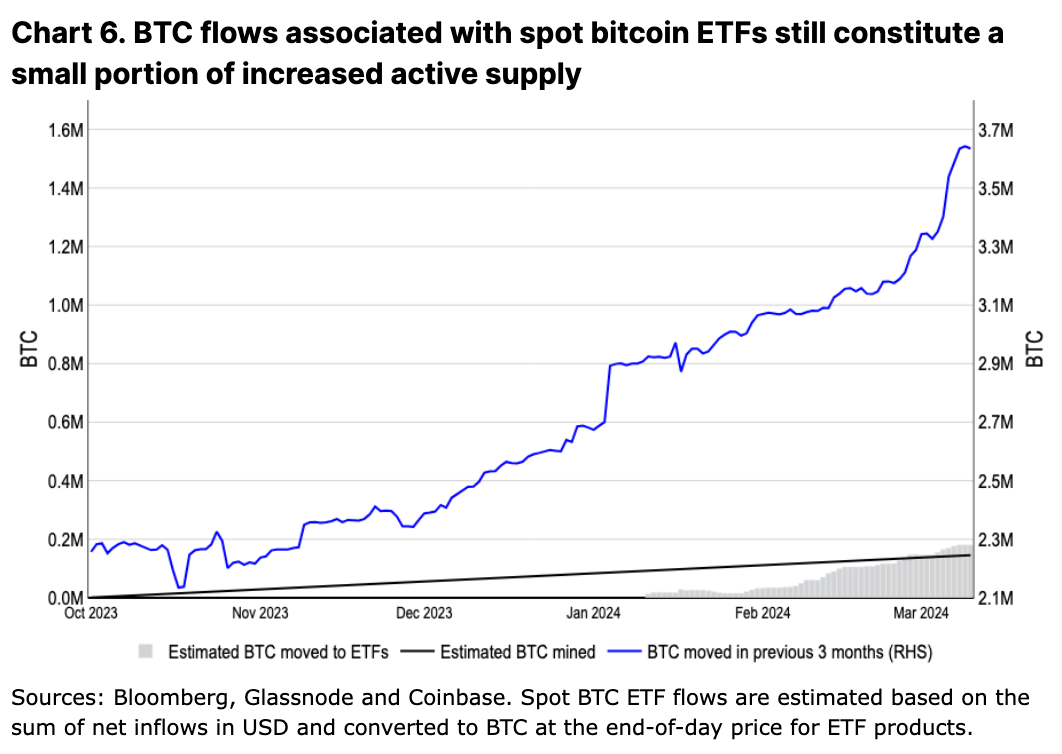
Even as bitcoin has been absorbed into ETFs, an increase in the amount of active circulating supply (which we define as bitcoin moved within the past 3 months) has substantially outpaced that of cumulative ETF inflows (see Chart 6). Since the start of 4Q23, there has been a 1.3M increase in active BTC supply compared to the far smaller ~150k of new BTC mined.
Some of this active supply does come from the miners themselves, who may be selling reserves both to take advantage of the price move as well as to build liquidity in anticipation of the unfavorable cut in revenues. We discussed this in more depth in our previous report “Bitcoin Halving and Miner Economics” (published January 30). This follows a similar pattern to what miners have done in past cycles. Still, Glassnode reports that the net balance in miner wallets has only decreased by 20,471 BTC between October 1, 2023 and March 11, 2024, meaning the lion’s share of newly active BTC supply is coming from elsewhere.
During previous cycles, changes in the active supply have outpaced the growth of newly mined bitcoin by more than a factor of five. In the 2017 and 2021 cycles, the active supply nearly doubled from 2.9M to 6.1M (3.2M increase) and 3.1M to 5.4M (2.3M increase) from troughs to peaks respectively (which happened in 11 months and 7 months). In contrast, approximately 0.6M and 0.2M new BTC were mined over those same timeframes.
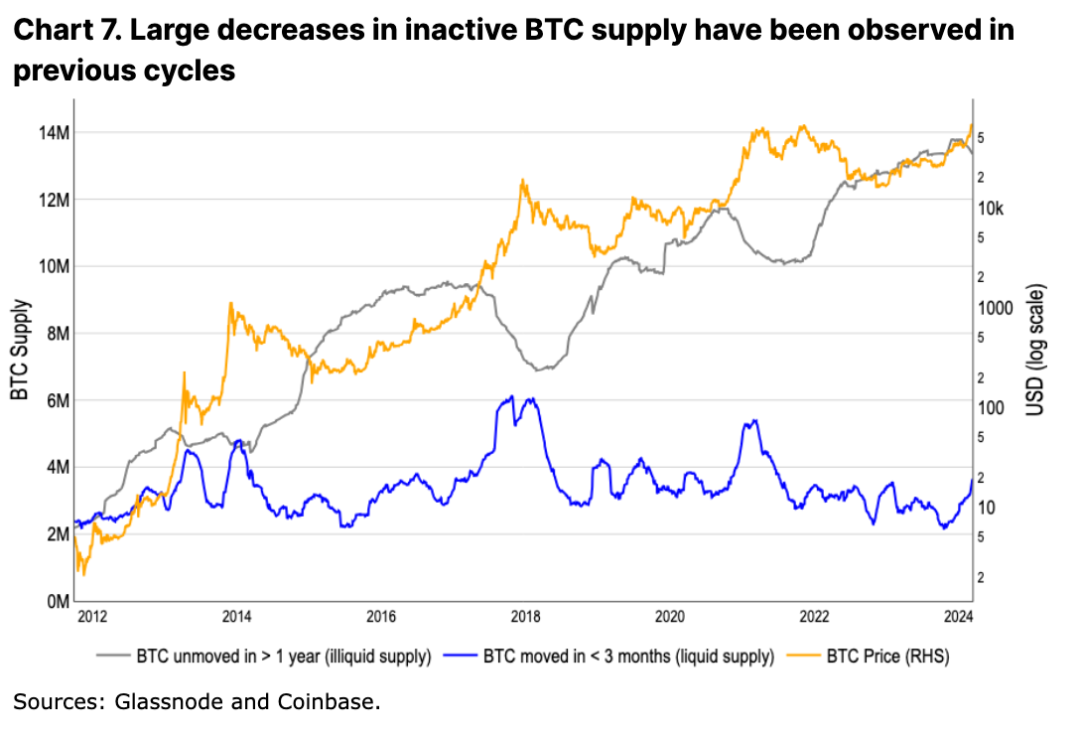
Meanwhile, the inactive supply of bitcoin (which we define as bitcoin unmoved in more than one year) in this cycle has also been declining for three months, which potentially represents long-term holders starting to sell (see Chart 7). Under normal conditions, this might be interpreted as an indication of a mid-stage cycle. In the aforementioned 2017 and 2021 cycles, there was a ~1 year timeframe (12 and 13 months respectively) from when the inactive supply peaked to when that cycle's top price was reached. The current cycle’s inactive token count appears to have peaked in December 2023.
However, it’s unclear exactly what percentage of this bitcoin has been transferred to exchanges (to sell), locked into bridges, or otherwise utilized in financial transactions (e.g. OTC trades). In fact, per Glassnode data, exchanges’ bitcoin balances have dropped this year by a net 80k BTC, even as the bitcoin transfer volumes into exchanges have doubled. That suggests that there are other pools of capital outside of the ETFs alone that are helping to offset this rise in transfer volumes from both long-term and short-term holders to exchanges.
Indeed, supply and demand dynamics in the spot market only captures one part of the story when it comes to quantifying aggregate flows of capital into and out of this asset class. Bitcoin exhibits a derivatives multiplier effect similar to commodities, where the notional value of bitcoin derivatives outstanding is significantly higher than the market cap of physical bitcoin. With bitcoin's derivatives markets amplifying spot volumes many times over, analyzing only the spot public exchange data presents an incomplete picture of true liquidity and adoption in the bitcoin economy.
Thus, while increased movement of dormant coins has coincided with prior bull market peaks, we believe that the precise dynamics of how supply and demand interact in the current environment remain less certain.
Conclusion
Truly, this cycle may be different. Consistent daily net inflows into US spot bitcoin ETFs continue to be a massive tailwind for the asset class, contributing to tighter market dynamics as the supply of newly mined bitcoin is soon due to fall by half. However, this doesn't necessarily indicate that we’re about to embark on a supply crunch scenario where that demand will outpace the selling pressure into this market. What’s clear is that ETFs represent the formal establishment of a new digital asset class that major financial institutions can now include in traditional portfolios, marking a significant milestone for mainstream adoption. Consequently, we believe the current price move is only the beginning of a longer bull run and that it will take further price appreciation in order to drive supply vs demand dynamics into balance.